Bitcoin moves through repeating market cycles tied to its halving schedule. A halving cuts the rate of new Bitcoin issuance roughly every four years, and each halving has preceded a period of price expansion followed by a contraction. Analysts use this rhythm to estimate where the market sits within a broader cycle.
Bitcoin reached its most recent all-time high near $126,000 on October 6, 2025. By early June 2026, the price had fallen to around $63,000, roughly 50% below that peak. This places the market in a contraction phase after the cycle top. Cycle theory gives a framework for reading this stage, but it cannot pinpoint an exact bottom. Because precise timing stays unreliable, many long-term participants use dollar-cost averaging to accumulate at regular intervals without trying to predict the lowest price.
What Is Dollar-Cost Averaging
Dollar-cost averaging (DCA) is a method where a buyer purchases a fixed amount of an asset at regular intervals, regardless of its price. The buyer might purchase a set dollar amount of Bitcoin every week or every month. The fixed schedule removes the decision of when to enter, so the buyer never has to judge whether a given day is a good entry point.
DCA replaces a single large purchase with many smaller ones spread over time. Because the schedule stays fixed, the buyer purchases more units when the price is low and fewer units when the price is high. This averages the entry price across the full period.
How Dollar-Cost Averaging Works
DCA follows a simple repeating process. The buyer sets a fixed amount and a fixed interval, then makes each purchase on schedule without reacting to price swings.
- A buyer chooses an amount, for example $100.
- The buyer sets an interval, for example once every week.
- The buyer purchases that fixed amount on each scheduled date, whatever the price is that day.
- Over many intervals, the purchases average out to a single blended entry price.
The fixed amount produces a useful effect. When the price falls, $100 buys more Bitcoin. When the price rises, $100 buys less. The average cost per unit then settles below the simple average of the prices the buyer paid, because more units were bought at lower prices.
This process reduces the impact of a single poorly timed purchase. A buyer who commits everything on one day carries the full risk of that day’s price. A buyer who spreads purchases across many dates spreads that risk across many prices. In a volatile asset like Bitcoin, where the exact bottom stays hard to identify, DCA lets a participant accumulate steadily without needing to predict the low.
How Bitcoin Cycles Have Historically Worked
A Bitcoin cycle is a recurring pattern of price expansion and contraction anchored to the halving. The halving reduces the block reward miners receive, so the supply of new Bitcoin entering the market drops. This supply reduction has historically come before extended price rallies, followed by deep corrections.
Past cycles peaked at similar intervals after each halving. Bitcoin reached its 2025 top about 530 days after the most recent halving, close to the timing of previous cycle peaks. Prior cycle bottoms formed at roughly comparable intervals, around 890 days after a halving. If this historical spacing repeats, the market has already passed the midpoint between peak and the next expected bottom.
In plain words: Past cycles peaked and bottomed at similar points after each halving. By that calendar, the market has likely passed the peak and moved toward the bottom zone.
Where Are We in the Cycle?
Long-Term Holders Keep Accumulating
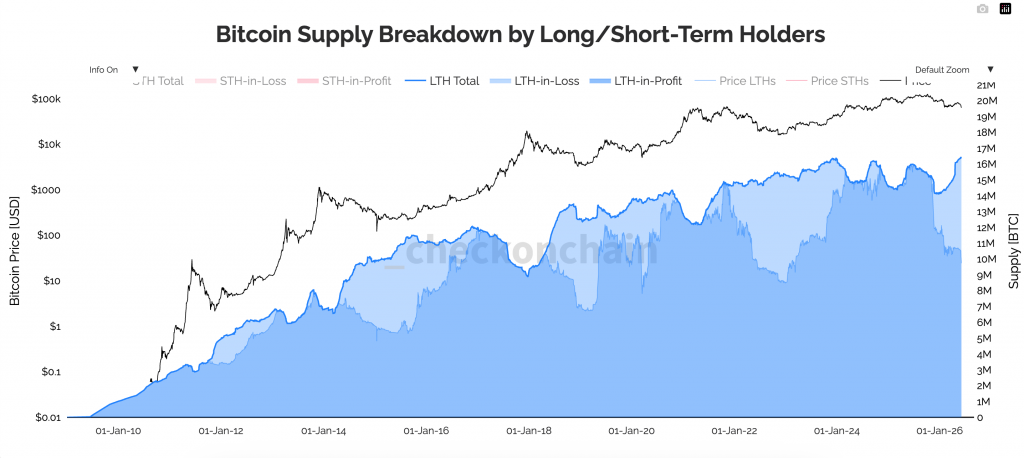
Long-term holders are addresses that have not moved their coins for an extended period. Think of them as the most patient participants in the market. They tend to buy during downturns and sell as price nears previous highs.
Long-term holder supply recently reached a new all-time high, with this group holding over 82% of all circulating Bitcoin. Their selling rate has also slowed sharply compared to cycle peaks. When long-term holders accumulate at this pace, it typically lasts until the bottom forms. The majority is already accumulating and DCA-ing, preparing for the next bullish cycle.
In plain words: The biggest, most patient holders own a record share of Bitcoin and have slowed their selling significantly. This pattern has historically appeared during the late stages of a bear market.
Fewer Holders Are Willing to Sell
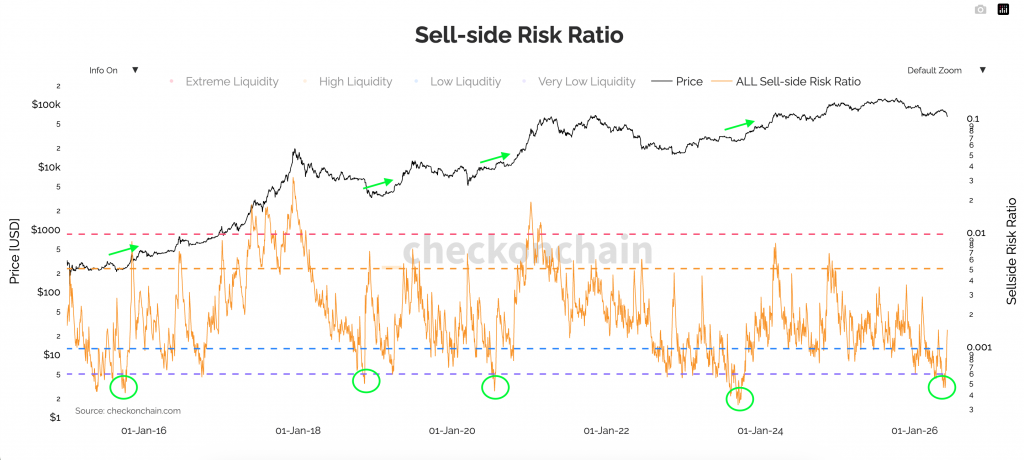
Bitcoin’s Sell-Side Risk Ratio recently reached its lowest level since 2023. Think of it as a measure of how eager holders are to sell. When it drops to multi-year lows, most holders are no longer rushing to take profits or cut losses. Selling pressure dries up because coins stay put and do not move to exchanges.
This is generally a positive sign, because markets tend to bottom when sellers become exhausted. With fewer people willing to sell, it takes less buying demand to stabilize prices and eventually push them higher.
In plain words: Fewer people feel the urge to sell right now. When sellers go quiet, it takes less buying to turn a market around.
Momentum Is Starting to Turn
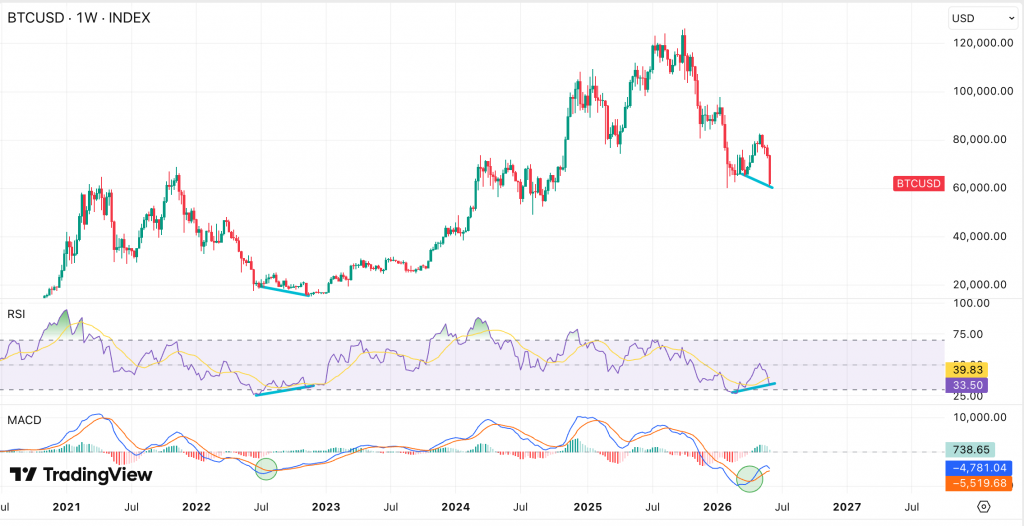
Momentum indicators show the strength behind a price move on a weekly chart. Two patterns have historically shown up near cycle bottoms.
A bullish RSI divergence happens when Bitcoin makes a lower low in price while the Relative Strength Index makes a higher low. The price keeps falling, but the selling force behind the move weakens. It’s often one of the first signs that a downtrend is running out of steam.
A bullish MACD crossover tells a similar story. It suggests momentum is starting to move from sellers to buyers, even before the price recovers. In previous cycles, these two patterns appeared together during the bottoming process, before the next uptrend began. As of early June 2026, RSI readings sit near oversold territory on several timeframes, which can mean selling momentum is fading.
In plain words: The chart is showing early signs that sellers are getting tired. These patterns have tended to appear near bottoms, not tops.
Why DCA Fits This Stage of the Cycle
Multiple signals suggest that Bitcoin may be moving through the later stages of its bear market. Drawdowns are getting shallower, long-term holders are accumulating at record levels, sell-side pressure has dropped to multi-year lows, and momentum indicators are flashing early reversal signs.
None of these signals can name the exact day of the bottom. That is exactly the point. Trying to time the perfect entry has historically been harder than simply accumulating on a regular schedule. DCA removes the guesswork. It lets a buyer build a position through the entire bottoming process and capture a blended entry price across many dates.
Long-term holders are already doing this. They represent the largest share of Bitcoin supply ever recorded, and their accumulation has continued for months. A DCA approach follows the same logic: buy consistently, stay patient, and let the cycle do the work.