Errors are sometimes unavoidable when traversing the crypto ecosystem. For beginner and even intermediate traders, many patterns on real world price charts can look and behave differently than textbooks and online resources indicate. A common pitfall for many traders is to rely too much on candlestick patterns to guide their crypto journey. However, when read incorrectly or without proper context, candlestick charts can lead to miscalculated positions and even potential losses.
To help avoid some of the most common mistakes traders make when reading candlestick charts, we prepared this helpful guide to help impart a more detailed understanding of these critical reference tools. Follow along below as we unpack what information can be gathered from candlestick charts, and how that knowledge can be applied while navigating the digital asset space.
What are candlestick charts?
First developed in the 18th century by Munehisa Homma, a Japanese rice trader, candlestick charts broke into the broader financial world with Steve Nison’s 1991 book Japanese Candlestick Charting Techniques which popularized Homma’s innovation. Today, candlestick charts are used to describe the price movements of securities, derivatives, and currencies in both traditional and decentralized finance.
Candlestick charts are used as a visual representation of multiple data points for an asset: its opening and closing prices, recorded highs and lows, and the overall range between these values during an allotted time period. In addition to providing insight into how an asset might be trending, candlestick charts can also be used to help visualize order book depth (i.e. liquidity) on an exchange.
In essence, candlesticks are elegant, information dense depictions of complex financial data. However, it’s critical to understand what these tools do not indicate before using them as a North Star for your crypto journey. Part of this can be solved by knowing which secondary resources can be used to supplement their findings. Another is knowing when to filter out the noise of an always-on market.
Finding meaning in every candlestick
When many aspiring traders first discover candlestick patterns, their first instinct is to search for meaning in every movement. While mathematical phenomena like the Golden Ratio can feel like supporting evidence for this notice, it’s important to remember that order and chaos both have equations to support them. In reality, crypto markets produce an immense amount of data, and learning to spot signals in the noise takes time and careful research.
By itself, a candlestick can be useful in discerning the general direction of a price action. However, these charts miss crucial elements that can only be determined through comprehensive analysis.
For instance, candlesticks only represent the final result of a day’s action, not the detailed sequence of events that occurred between open and close price detailing the commerce of that asset. In a space as fast paced as the crypto ecosystem, a lot can happen in a day. In turn, the upper and lower shadow lines of the candle which represent a given day’s record high and low fail to reveal which happened first. The world of competing bearish and bullish sentiment requires that this important detail be included in traders’ market analysis. This fact alone often has users seeking to corroborate their candlestick readings with other available resources.
Using candlesticks without checking support and resistance levels
Much like icebergs, candlestick charts only reveal a fraction of the totality they represent. While perhaps visually pleasing, the upward and downward movements of a graph don’t provide the parameters in which these movements are operating. Namely, the prevailing support and resistance levels manifesting in a given market. Without overlaying this outside context, price movements can appear as if they’re happening of their own accord. In reality, nothing could be further from the case.
Support and resistance levels help reveal the overall climate surrounding an asset. Traders will often look to moments when the price is testing these lines to try and discern whether bulls or sellers will choose to apply pressure on the market. Once these levels have been located, more accurate patterns can begin to emerge. One such indication can be the appearance of reversal patterns near major resistance or support lines. Historically, this helps indicate the validity of both the pattern and the line in question.
For example, let’s examine the chart below:
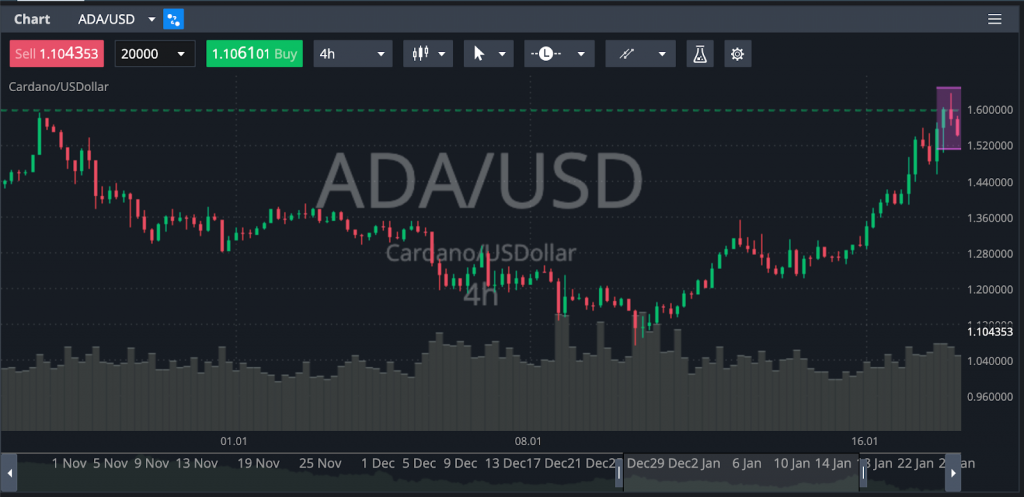
The price approached the resistance level which bulls had already tried to break once before (highlighted in purple above). But buyers didn’t manage to consolidate the rate above the resistance level. As a result, a triple candlestick pattern known as Three Inside Down formed on the chart.
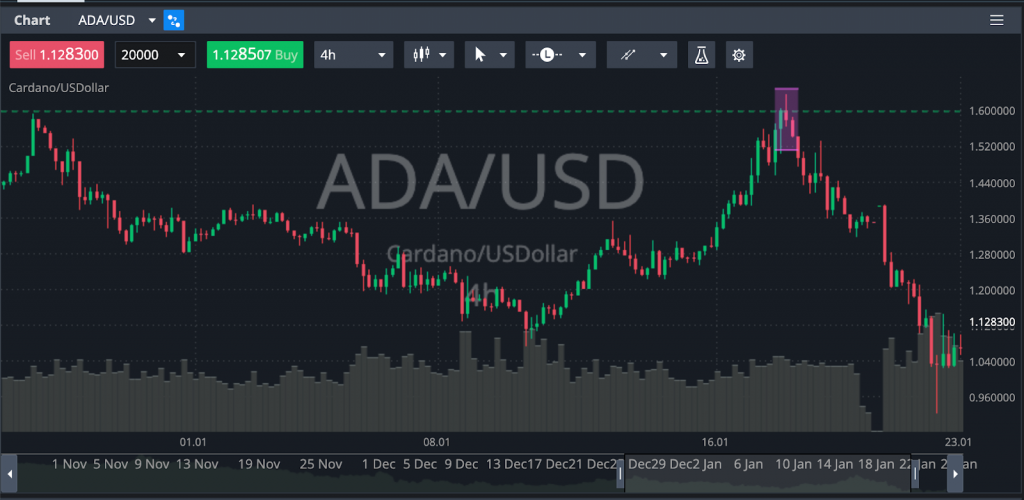
Since bulls failed to break resistance, this in turn strengthened the bearish sentiment of the line, and helped bears change the market trend. While this is just one possible outcome that can occur at a support or resistance level, it’s important to remember that every moment in the market is informed by an entirely new set of overarching factors. Just because the price responded to resistance in a particular way once does not mean those actions will be repeated on a subsequent approach. That being said, using candlestick charts in conjunction with support and resistance levels can often result in a more thorough understanding of each resource.
Searching for recognizable patterns
As we’ve hopefully established by this point, there’s only so much information that can be garnered from a candlestick chart. Moreover, these tools exist to give a consolidated look at several compounding factors in one clean design. That being said, if the temptation strikes to zoom in or squint to parse some arcane detail from the chart, it may be wise to pause and re-evaluate the situation. While useful, technical analysis can also run the risk of being dangerously self-reproducing. This can result in some traders waiting for specific patterns to replicate in an effort to mirror prior movements. Since we now know each new market moment is informed by an entirely novel set of conditions, similar seeming patterns can often yield widely different outcomes.
To this end, it’s important to understand that textbooks, guides, and even this article, can only highlight certain instances that have existed historically: these patterns will likely never reproduce themselves in exactly the same fashion. Therefore, it’s important to take information gathered from candlestick charts with a grain of salt, and to always cross check any hunches with other, complementary resources. En route to a more complete picture of the current market landscape, candlestick charts can serve as a generative foundation to begin further research through the application of additional tools.
Trading without waiting for confirmation
Now that we’ve hammered home why candlestick charts should rarely be consulted without secondary research, let’s focus on some of the ways that they can reveal standalone information. Some traders fall victim to the assumption that candlestick patterns are self-confirming, but like most things, nothing is official until it comes to pass. With that in mind, it’s important to avoid jumping to conclusions before market data has had a chance to cool.
Oftentimes, the safest way to confirm if a price trend is in fact unfolding is to confirm it through patience and observation. Rather than reacting to the first sign of movement, allowing a series of candles to form can help ensure the trend that appears to be happening is in fact taking place. While we’ve noted the immense pressure to react in real time when value and assets are on the line, prudence can go a long way towards keeping more emotional trades in check. Success in the crypto ecosystem is often distilled to luck and timing, but patience and carefully applied knowledge are the real tools of a seasoned trader.
Looking for more crypto knowledge? Wander over to CEX.IO University for the latest research and analysis, or head over to our product ecosystem to put your skills to the test.
Disclaimer: Information provided by CEX.IO is not intended to be, nor should it be construed as financial, tax or legal advice. The risk of loss in trading or holding digital assets can be substantial. You should carefully consider whether interacting with, holding, or trading digital assets is suitable for you in light of the risk involved and your financial condition. You should take into consideration your level of experience and seek independent advice if necessary regarding your specific circumstances. CEX.IO is not engaged in the offer, sale, or trading of securities. Please refer to the Terms of Use for more details.