Tweezers
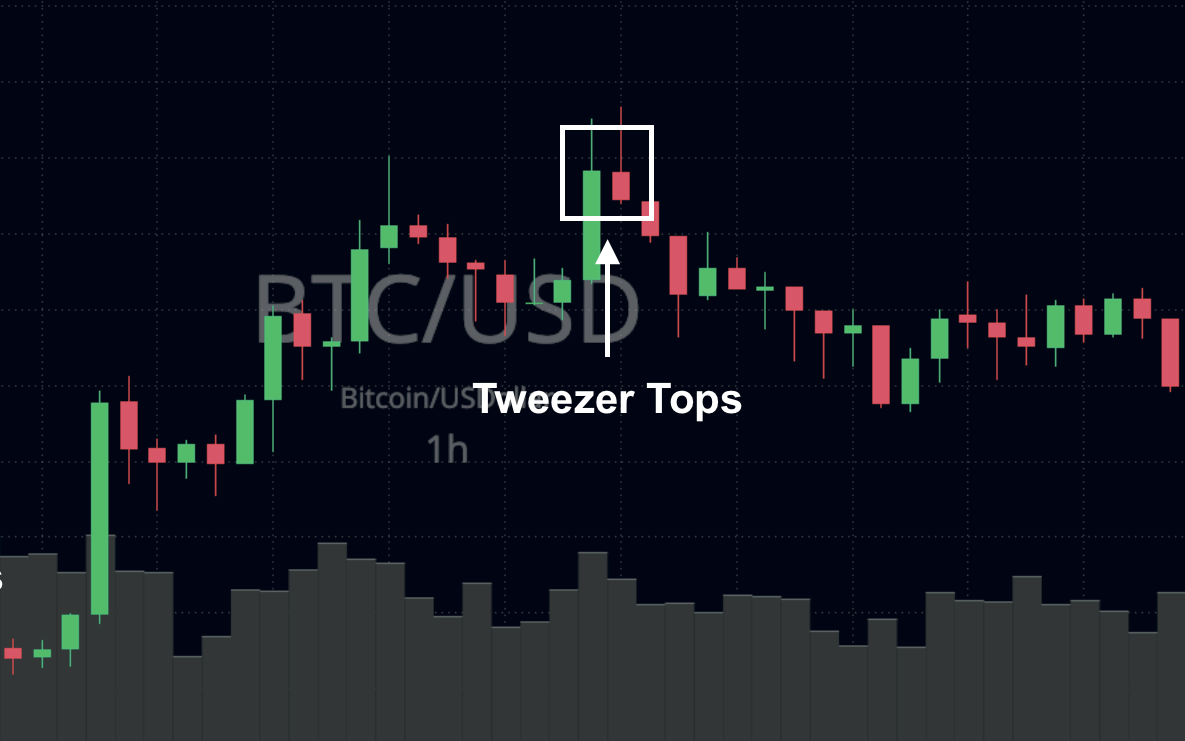
Tweezer tops and bottoms, also known as tweezers, are reversal double candlestick patterns that may signal a potential change in the price direction.
The Tweezer patterns include two candles — bearish and bullish. They touch the same bottom (for bottom pattern) or top (for a top pattern).
- Tweezer Bottoms pattern appears following a decline. The first candle is bearish (red) and the second is bullish (green), both share the same low and moderate bottom tail (shadow) length.
- Tweezer Tops pattern occurs following a rise. The first candle is bullish and the second is bearish, both share the same high and moderate top tail (shadow) length.

Signal:
Tweezer patterns may indicate the shift in the trend direction. The Tweezer Tops pattern may be a signal of reversal downward. At the same time, the Tweezer Bottoms pattern may indicate reversal upward.
Formation:
Tweezers are formed by two opposite candles, a bearish and a bullish one, that occur at the end of a trend and have matching highs or lows. The perfect scenario of a Tweezer formation assumes that the size, tops/bottoms, and shadows of the two candles are very similar. The pattern will be even more powerful if they are twin-like.
But it doesn’t mean that all tweezers are equal. It is possible to find examples where the first candle is extremely strong and the next one is Doji (or another candle that doesn’t look as strong as the first one).
Tweezer patterns are valid only when they occur during uptrends and downtrends. Their appearance during choppy trading conditions is practically meaningless, and it signals the market indecision to move in either direction.
However, it’s important to note that Tweezers don’t indicate how strong the trend may be. Meaning the pattern doesn’t show the information about how long the trend will last and what price rise or fall to expect.

Engulfing candles
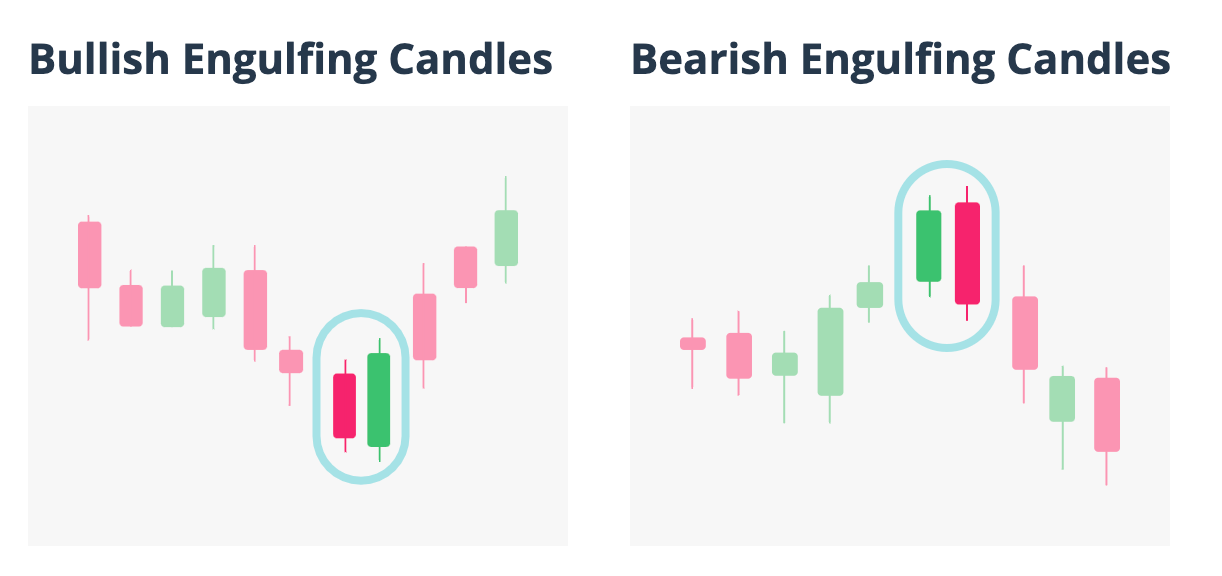
Engulfing candles pattern consist of two candlesticks, where the second candle’s body overlaps (engulfs) the body of the first candle.
Engulfing candles are one of the most popular candlestick patterns, used to determine whether the market is experiencing upward or downward pressure. Depending on the current market trend Engulfing Candles can be both Bearish or Bullish.
- Bullish Engulfing Pattern: a bearish candle (red) followed by a bullish candle (green) of a larger size, which completely engulfs the body of the previous candle.
- Bearish Engulfing Pattern: a bullish candle (green) followed by a bearish candle (red) of a larger size, which completely overlaps (engulfs) the body of the previous candle.
Signal:
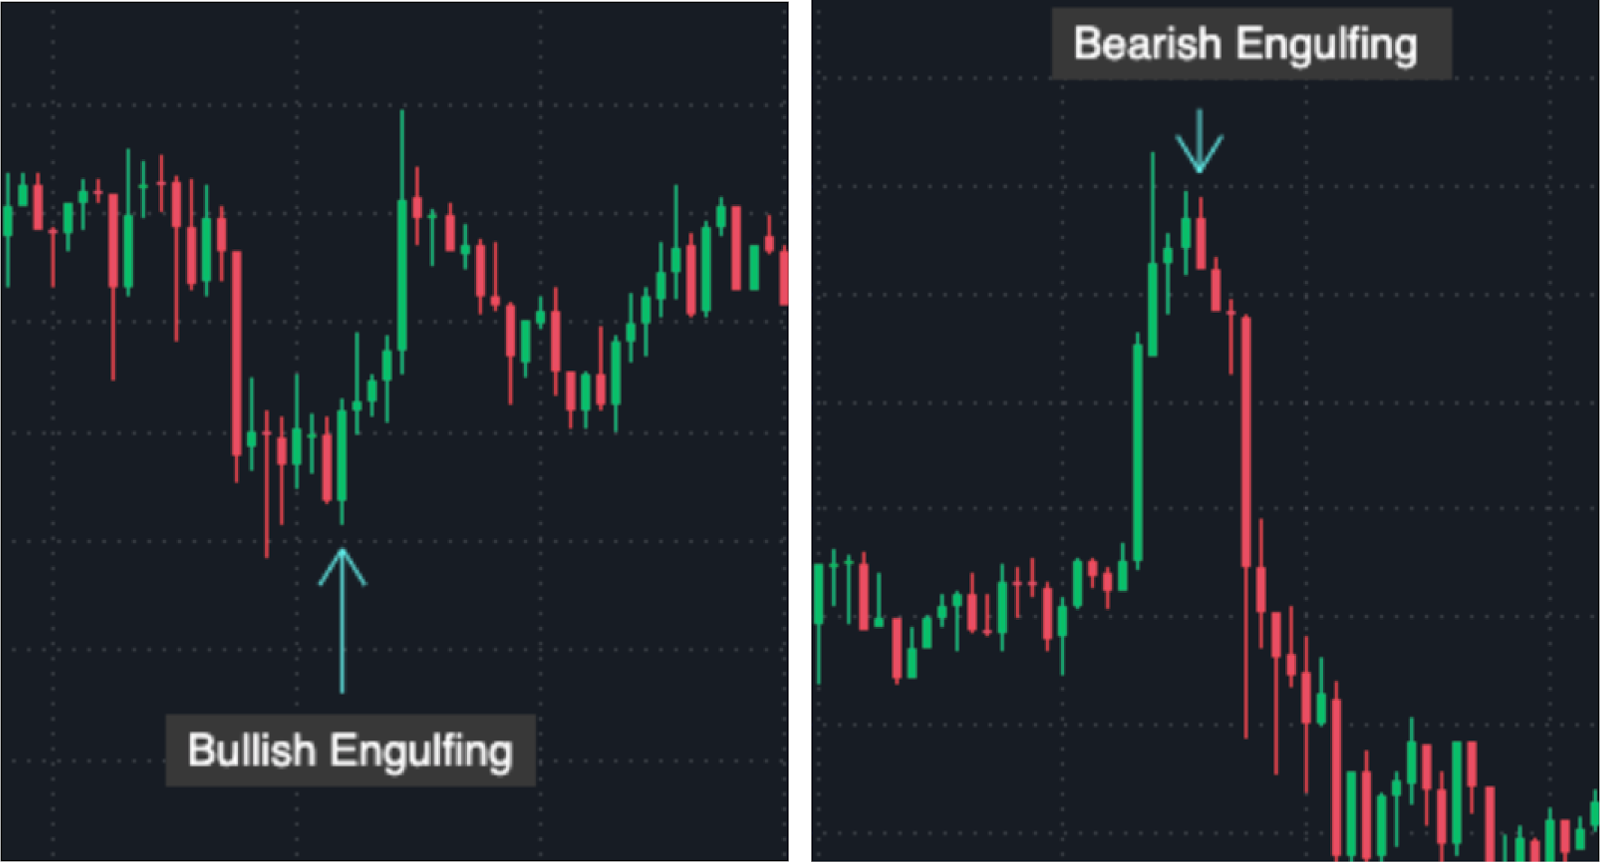
Both Bullish and Bearish Engulfing candles can indicate that the market is about to change its direction. If the Bullish Engulfing Pattern occurs during a downtrend, it may signal a reversal upward. Similarly, if the Bearish Engulfing Pattern follows the bullish candlesticks, it may indicate the upcoming reversal downward.
Formation:
Bullish Engulfing candles provide the strongest signal when appearing at the bottom of a downtrend and indicate a surge in buying pressure. Despite the dominance of the sellers when the second candle opens below the previous candle’s close (gap down), buyers are taking over. More buyers enter the market and drive prices up. So, the second candle closes above the previous candle’s open (gap up).
Bearish Engulfing candles pattern is opposite to the bullish. It shows the strongest signal while appearing at the top of an uptrend and a surge in selling pressure. The bulls still have an upper hand when the second candle opens above the previous candle’s close. Yet, they cannot maintain the dominance and give up to the sellers, who push the price down. The sentiment is changed when the second candle closes below the previous candle’s open.
The larger the second candle in both patterns, the stronger is the reversal signal. To be valid, the patterns require the next candles to confirm the reversal.
Harami
The word Harami originates from the Japanese word meaning “pregnant”, describing a pattern that looks somewhat like the belly of a pregnant woman.
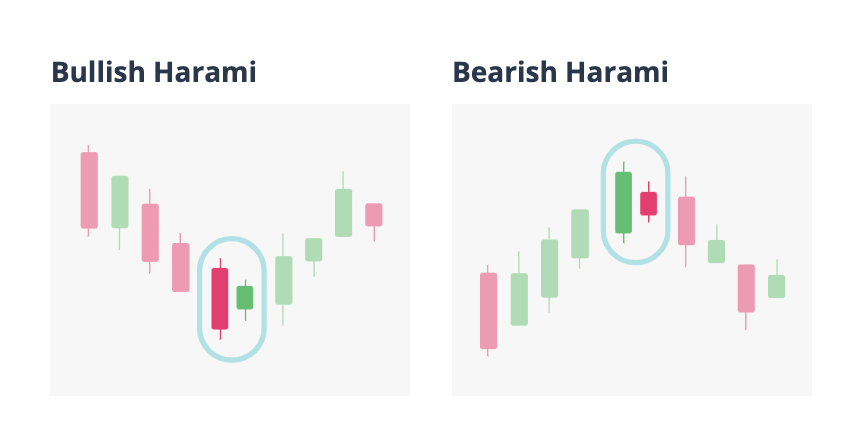
Harami is a candlestick pattern consisting of a large one and the following small-body candle, “contained” within the body of the first candle.
If occurring in a trend, the Harami pattern most likely suggests the forthcoming price reversal.
The Harami candlestick pattern can be both bullish and bearish.
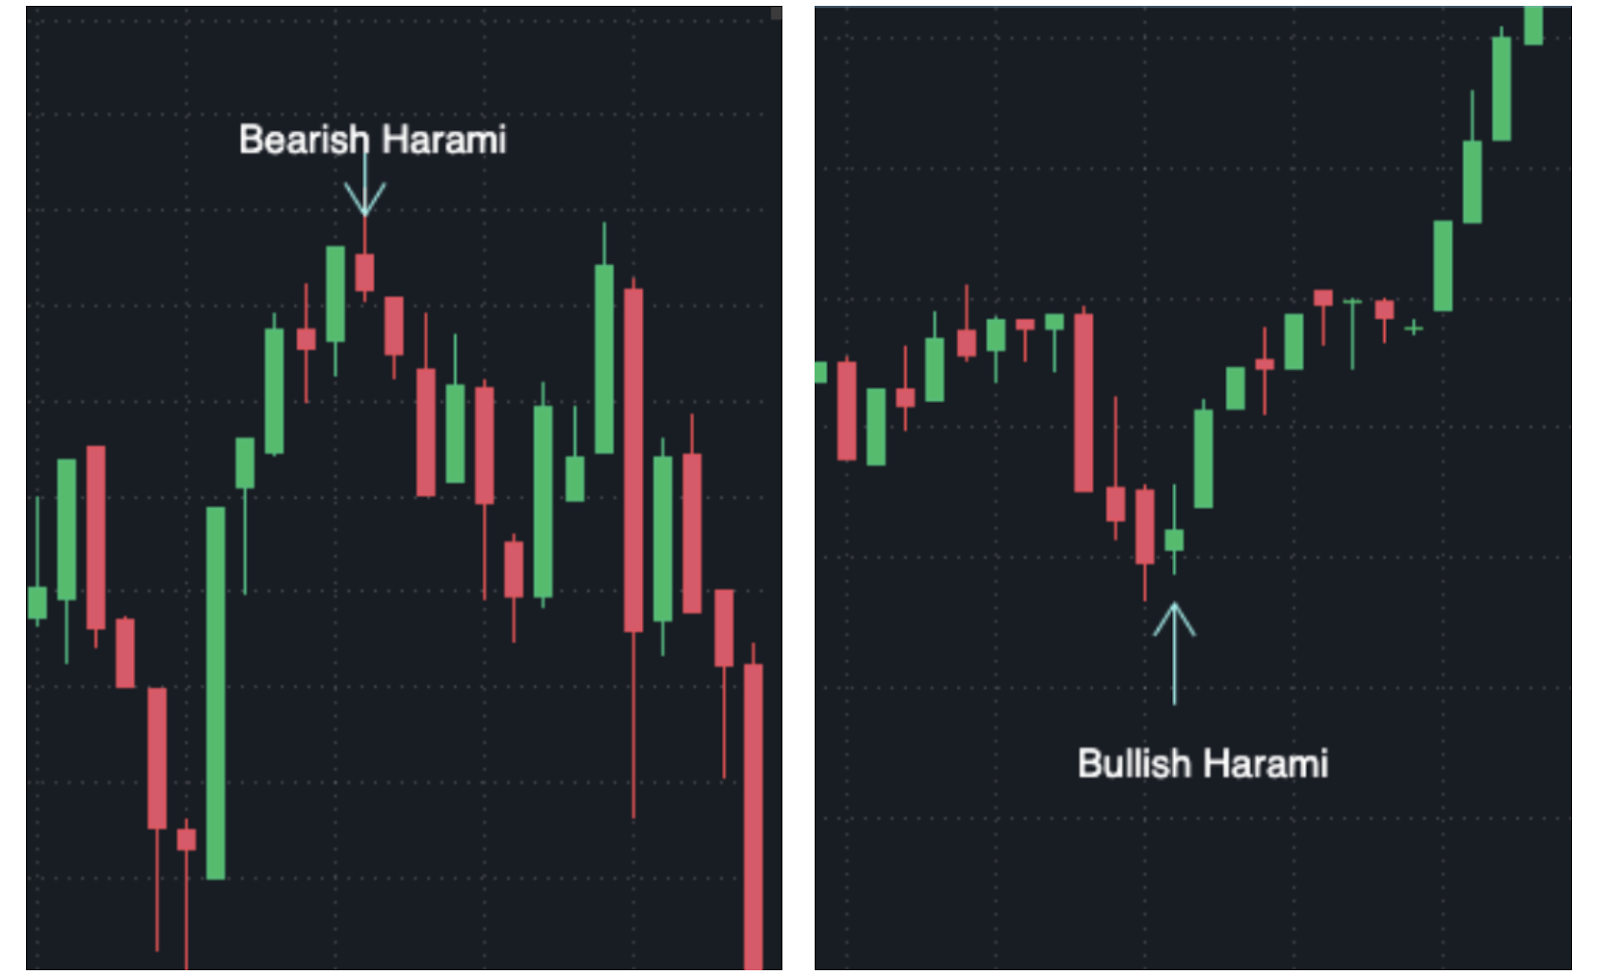
- Bullish Harami: A Bullish Harami occurs with a large bearish (red) candle followed by a smaller bullish (green) one, contained within the previous candle’s body.
- Bearish Harami: A Bearish Harami occurs when there is a large bullish (green) candle followed by a smaller bearish (red) one, contained within the body of the previous candle.
Signal:
If found in a downtrend, the Bullish Harami can be a signal for a reversal upward. In the same way, if the Bearish Harami pattern occurs during an uptrend, it should be considered as a signal for potential reversal downward.
Formation:
Following a downtrend, the second (green) candle in the Bullish Harami opens above the previous candle’s close. And it closes below the previous candle’s open price. Such price gaps between two candles indicate the weakening of the sellers and signify the potential change of the momentum.
The reverse applies to the Bearish Harami. Following an uptrend, the second (red) candle in the pattern opens below the previous candle’s close and closes above the previous candle’s open. Similarly, the price behavior makes the continuation of the uptrend uncertain and likely signals a downward reversal.
Neither Bullish nor Bearish Harami should be traded on the formation itself. Look for confirmations in the following candles and technical indicators to support the reversal.
Piercing Line/Dark Cloud Cover
Both Piercing Line and Dark Cloud Cover are patterns that indicate further price reversal.
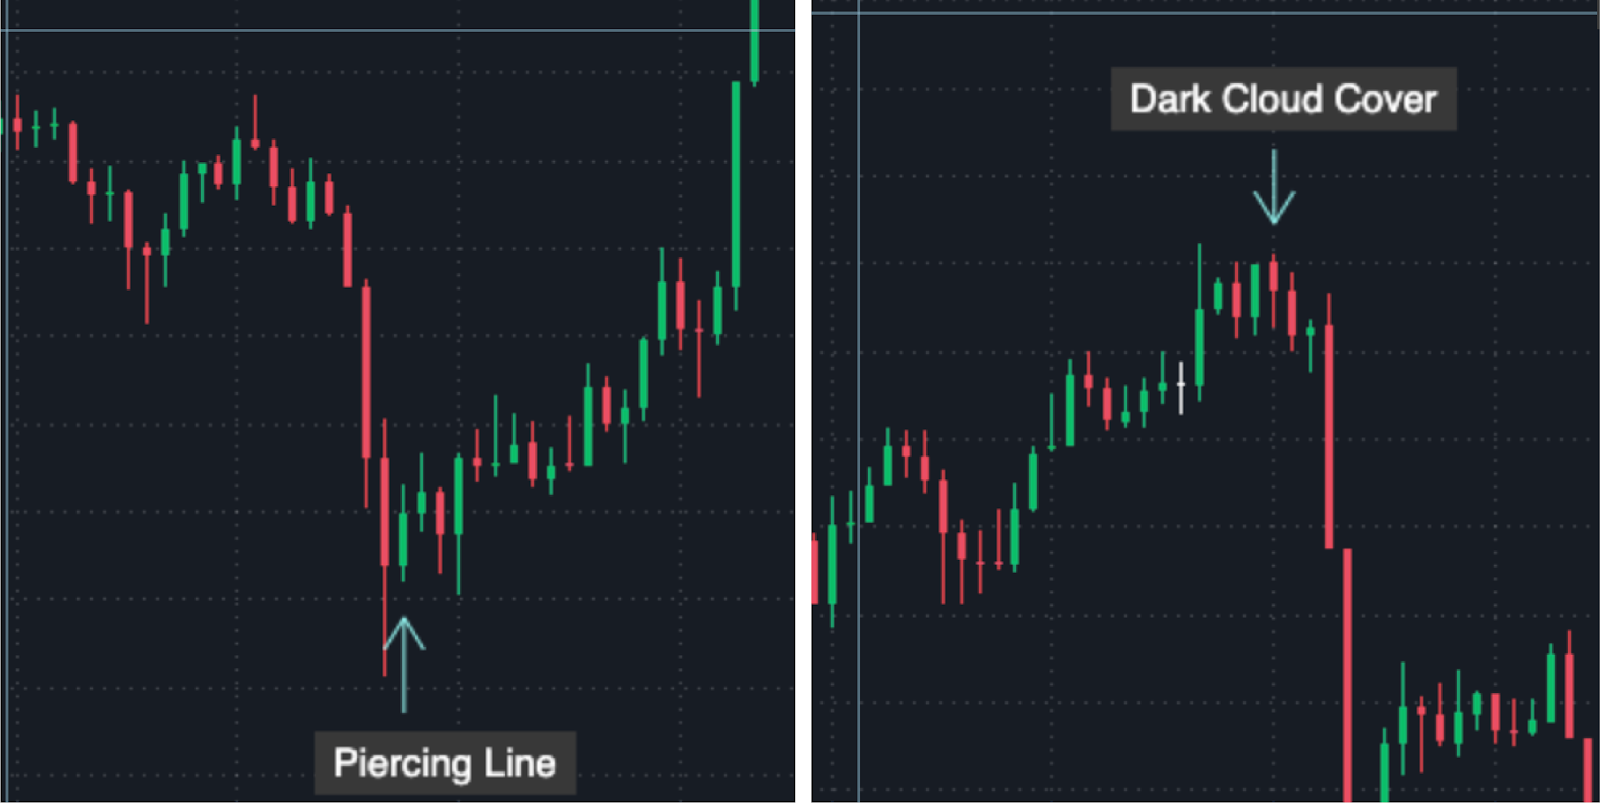
The Piercing Line Pattern is a bullish candlestick pattern of moderate reliability and is formed at the downtrend, or even at possible support. The Piercing Line is formed by a bearish candle and followed by a bullish candle with the open lower and the close above 50% of the first candle’s body. It indicates that bears are losing their control and bulls are taking over.
The opposite refers to Dark Cloud Cover. It is a combination of a bullish candle, continuing an uptrend, followed by a bearish candle with the open higher and the close below the 50% of the first candle’s body.
Both candles should be relatively large, showing strong participation by traders and investors. When the pattern occurs with small candles it is typically less significant.

Signal:
The Piercing Line indicates a potential short-term upward reversal, especially if the next candle is bullish.
At the same time, Dark Cloud Cover indicates a short-term downward reversal, especially if the next candle is bearish.
Formation:
The “Piercing Line” name is descriptive of how the pattern looks. The second, bullish, candle “pierces” through the midpoint of the previous, bearish, candle. While bears remain in control during the first candle formation, their attempts to push the price lower weaken in the second candle. The higher the second candle closes, the higher the probability of the reversal. Moreso, if the reversal is confirmed by the following bullish candle.
To remember the “Dark Cloud Cover” pattern, visualize how the second, bearish candle, hangs over the preceding bullish candle as a gloomy cloud. It covers more than 50% of its neighbor’s body, indicating that the “sunny days” of growth might be over. The bulls, reigning the previous periods, are losing the grip. Reversal downward is considered “more confirmed” if the pattern is followed by a bearish candle.
Kicker
The Kicker is a double candlestick pattern with a price gap between the candles. The first candle in the pattern continues the established trend, while the second candle opens with a gap and moves in the opposite direction from the previous candle.
Kicker Pattern represents one of the most reliable reversal patterns and can be bullish or bearish.
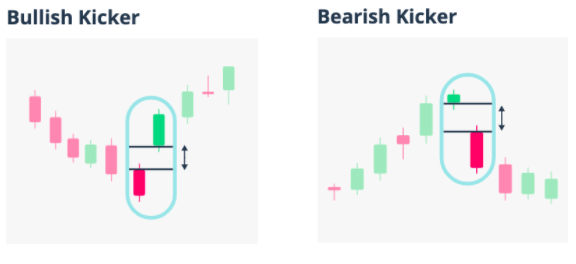
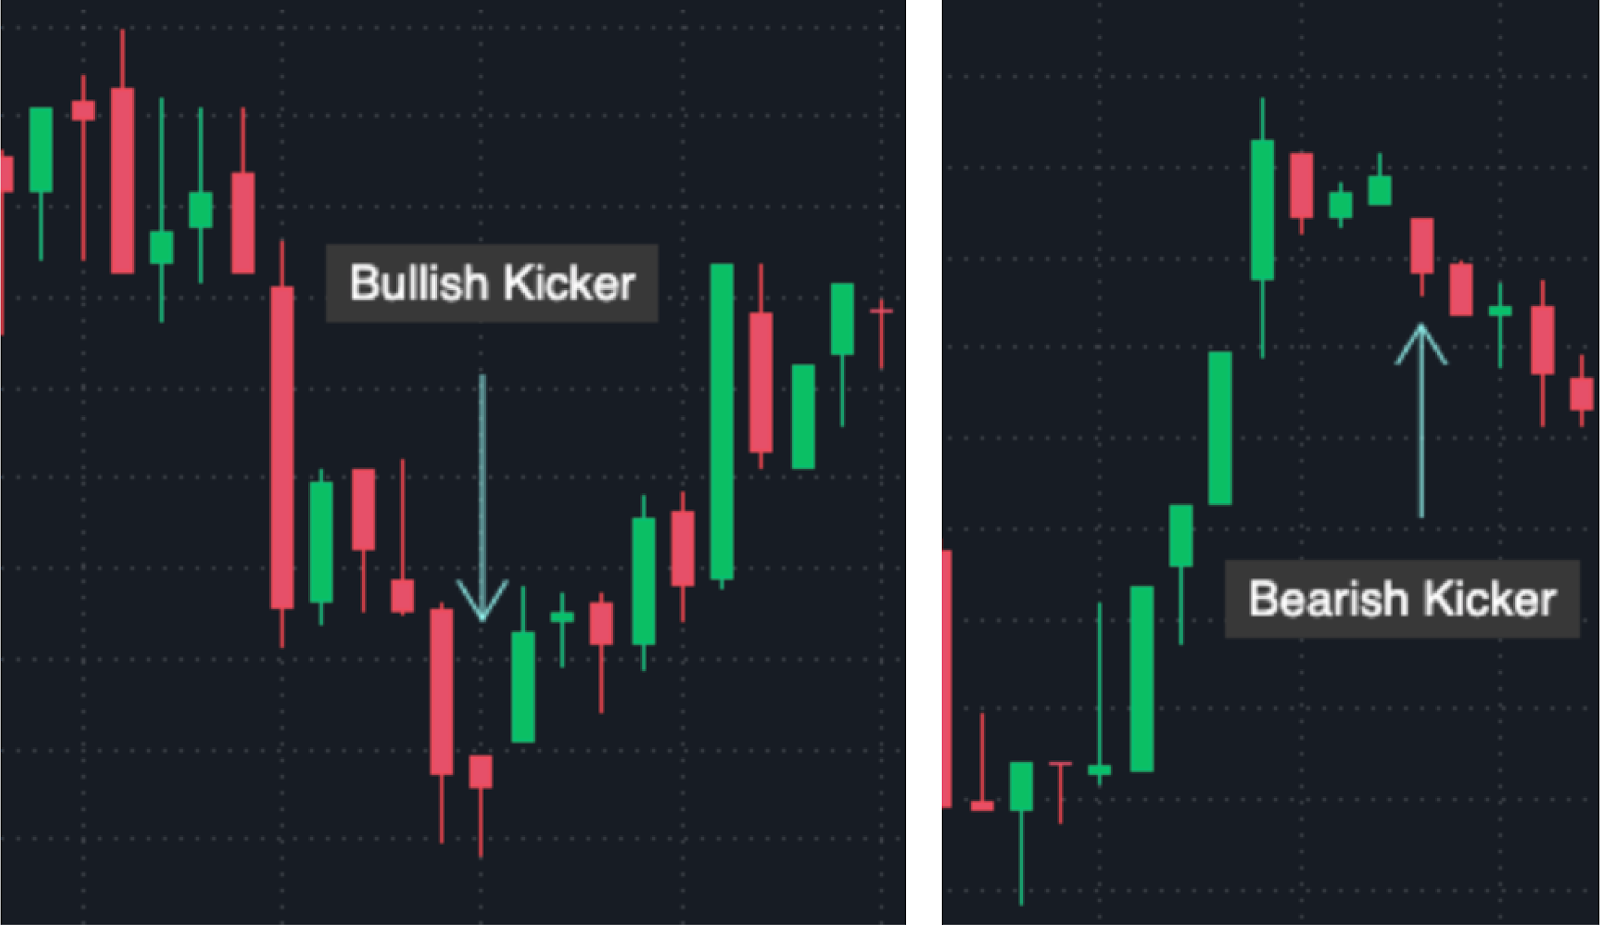
- The Bullish Kicker Pattern develops during bearish price movements. It is formed by a bearish candle, continuing a downtrend, followed by a bullish candle with the open at the level or higher than the previous candle’s open.
- The Bearish Kicker Pattern appears during bullish price movements. The pattern consists of a bullish candle, continuing an uptrend, followed by a bearish candle with the open at the level or lower than the previous candle’s open.
In the Kicker pattern, candles never overlap each other and usually have no shadows or very small shadows.
Signal:
Both Bullish and Bearish Kicker patterns are powerful signals for the trend reversal. The bigger the gap, the stronger the signal.
When you spot a Bullish Kicker Pattern on the chart, it may be a signal to open Long positions. Conversely, if you identify a Bearish Kicker Pattern, it may be a signal to go Short.
Formation:
The pattern points to a strong change in investors’ and traders’ attitude. It usually occurs following some valuable information about the asset or industry. The Kicker’s relevance is magnified when it occurs in overbought or oversold markets.
In the Bullish Kicker Pattern, the first candle shows that the bears continue to dominate the market. But the situation is turned around rapidly as the next candle opens above the previous candle’s open, forming a gap up. When the candle proceeds to form as bullish, the buyers are now in control, reversing the trend.
Bearish Kicker Pattern starts with a candle that continues an upward trend. Yet, when the next candle opens below the previous candle’s opening price (gap down), the balance of power is shifting towards the sellers. They take control over the buyers as the candle closes down, kicking off the downtrend.
The strong trading volume further solidifies the strength of both patterns.
Disclaimer: For information purposes only. Not investment or financial advice. Seek professional advice. Digital assets involve risk. Do your own research.