There are a number of major moving average time-lengths widely used in the industry, which help people understand the dominating trend of an asset.
If the price of an asset is significantly below the values of major moving averages, this can indicate the asset is underpriced, while if the price of an asset is significantly above the values of major moving averages, this can indicate the asset is overpriced.
In that sense, moving averages are a practical tool to determine important support and resistance price levels.
Moving averages are lines on a price chart, which move along with time in response to the spot price changes.
What is a Simple Moving Average (SMA)?
A simple moving average (SMA) is an arithmetic average calculated by adding up all the closing prices of an asset in a given time length and then dividing that sum by the number of individual time periods in that time length.
For example, SMA100 is the average price of an asset in the last 100 time periods (hours, days, weeks etc). If the timeframe is daily, then it would be the simple moving average price in the last 100 days. If the timeframe is weekly, then it would be the simple moving average price in the last 100 weeks etc.
What is an Exponential Moving Average (EMA)?
The exponential moving average (EMA) is designed to improve on the idea of a simple moving average by giving additional weight to the most recent price data, which is considered to be more relevant than older data. Since new data carries greater weight in EMA, it responds quicker to spot price changes than the SMA.
SMA or EMA?
Whether to benefit from SMA or EMA depends on market conditions.
If you believe recent market developments related to your asset of interest are important, you can opt with EMA. EMA reduces the effect of the lag created by older price data and can let you identify a trend earlier. In that sense, it is a useful indicator to trade in the shorter-term.
Conversely, you can stick to SMA if you would like to see an unbiased, longer-term average figure for your asset of interest.
How to Draw Moving Averages on a Price Chart?
A moving average is basically a dynamic line on a price chart that moves along with the time axis in response to the spot price changes.
You need to go to CEX.IO Broker to draw moving average lines on a price chart.
When you open the price chart for any currency pair (such as BTC/USD), you need to select the timeframe of your interest (hours, day, week), which is the dropdown menu right next to the Buy button on top of the chart.
Edit Studies
Once you select your desired timeframe, you need to click on the Edit Studies button to the right. Out of the available studies in that menu, you need to find either SMA or EMA, or both if you like.
Then you click on the + button down below and determine your time length for the moving average line out of the dropdown menu in the middle.
You can select up to 5 moving average indicators per price chart.
Important Moving Averages
Some major moving averages that the market uses to determine support and resistance price levels, or uptrends and downtrends are;
EMA 9
SMA10
SMA 20
EMA 21
SMA 30
SMA 50
EMA 55
SMA 100
EMA 123
SMA 200
SMA 400
EMA 400
SMA 600
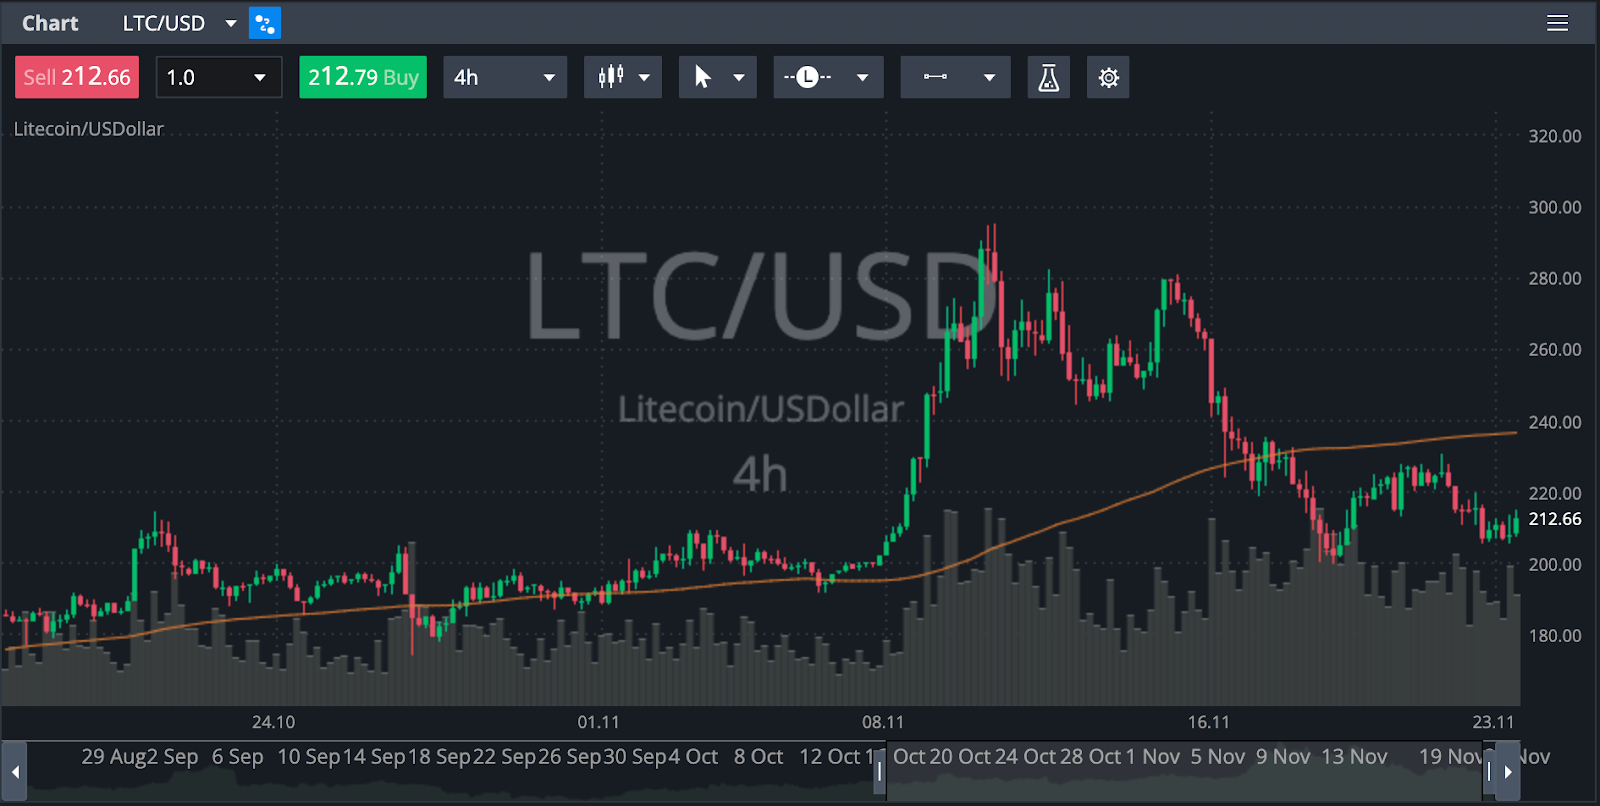
Regardless of the timeframe you analyze on a price chart, moving averages with larger time lengths, such as 50, 100, 200 indicate major support and resistance price levels on that timeframe.
In that light, if the current price is significantly below the larger moving averages, it may suggest that the asset is currently in a downtrend and underpriced within the timeframe you look at.
Likewise, if the current price is significantly above the larger moving averages, it may suggest that the asset is in an uptrend and overpriced.
Direction of Moving Average Lines
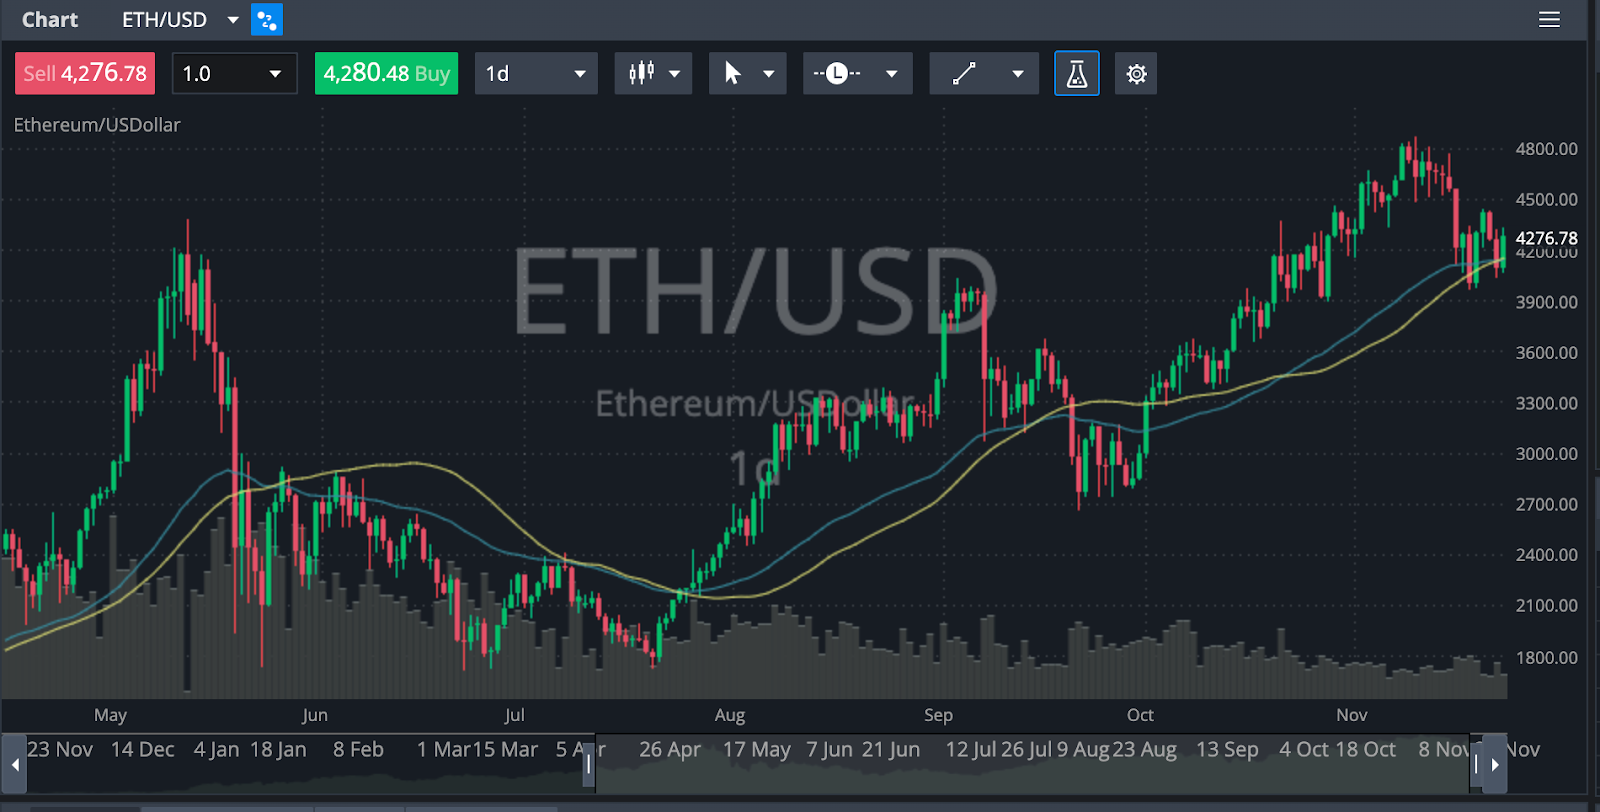
The direction of moving average lines on a price chart could also indicate about the trend.
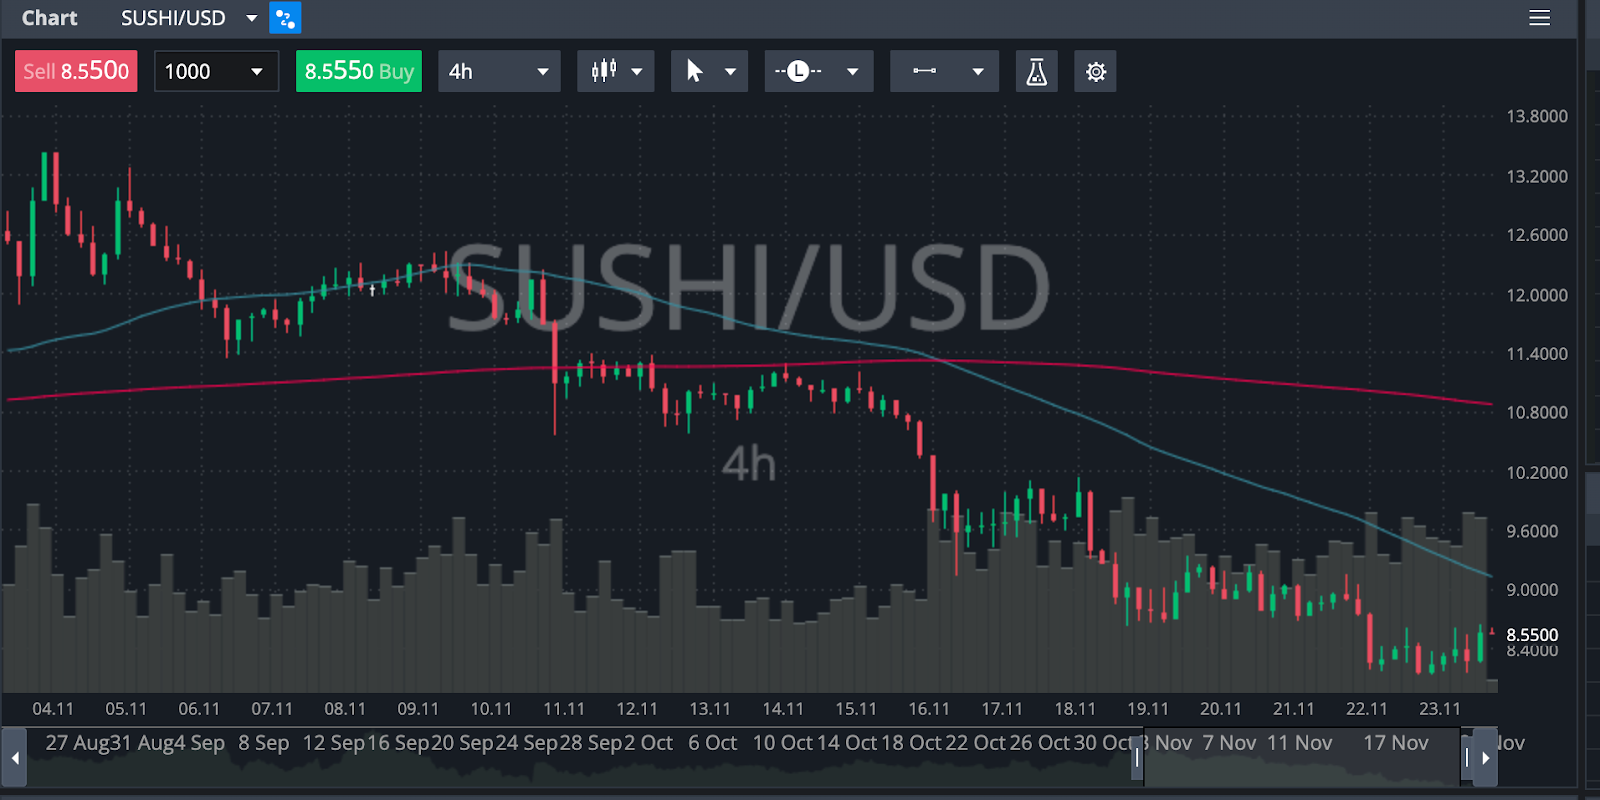
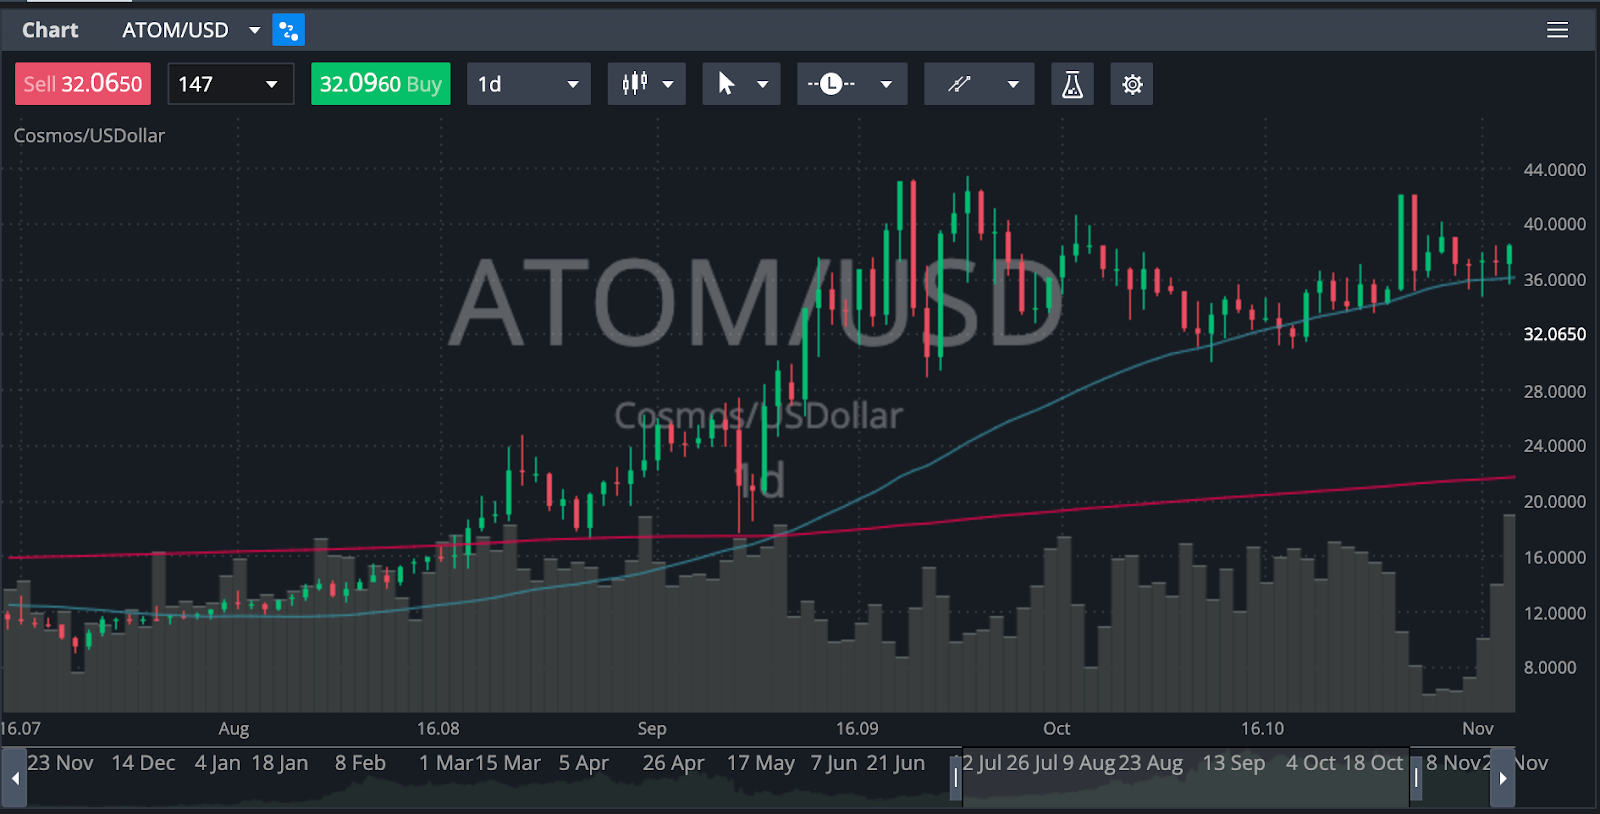
If the major moving average lines head strongly downwards, this may indicate an ongoing strong downtrend and if the major moving averages head strongly upwards, it could then indicate an ongoing strong uptrend.

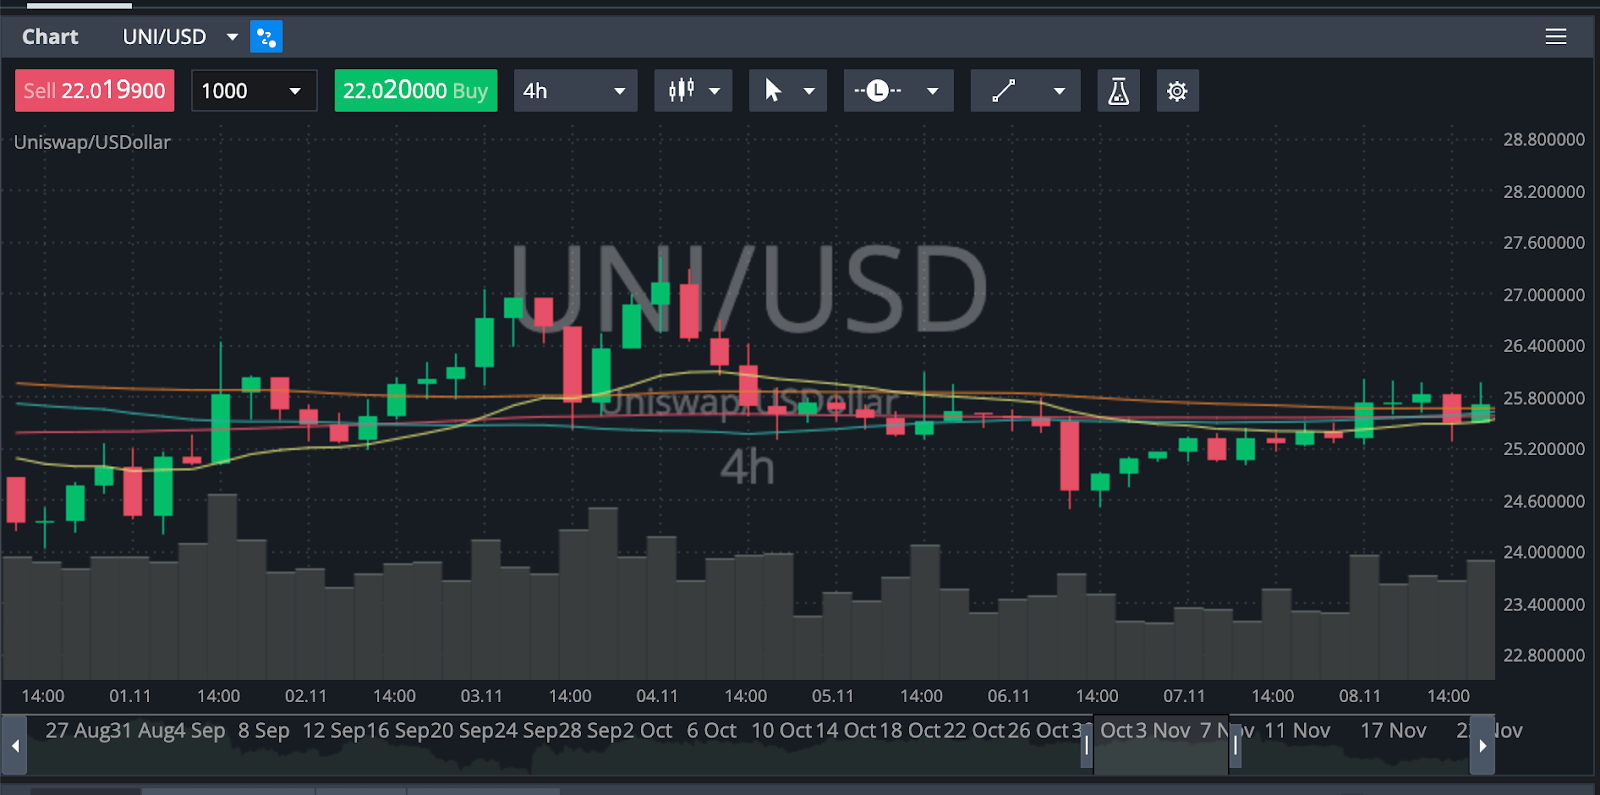
Major moving average lines that are entangled with each other may indicate indecisiveness in the market, which could result in horizontal, sideways price-ranging for some time.
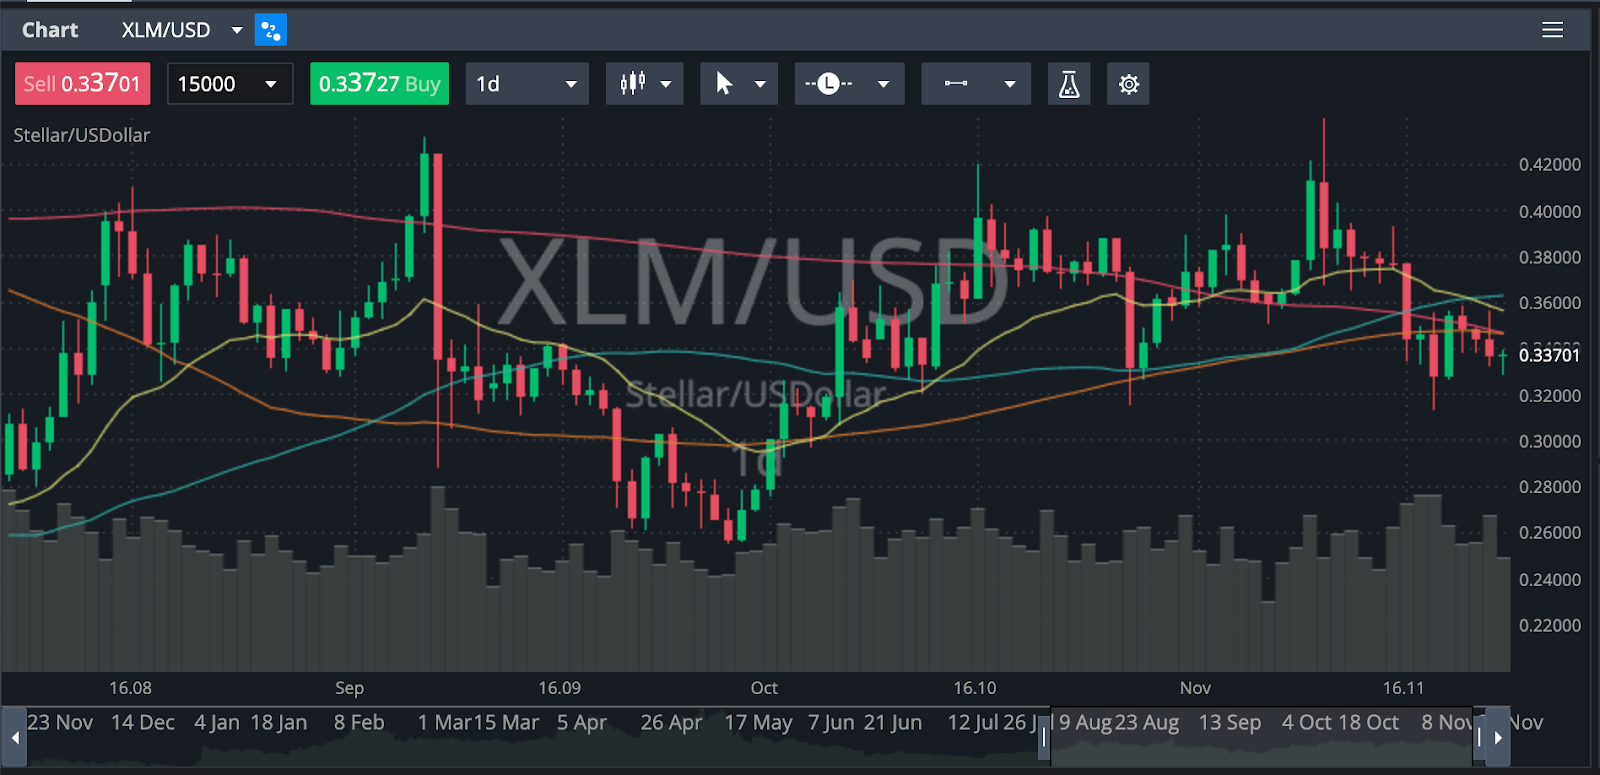
On the other hand, moving average lines that turn horizontal to each other (lined up like guitar strings) may suggest that they will not cross each other in the foreseeable future, which indicates a balance between supply and demand and that a trend reversal is likely.
Tip:
You should keep in mind that moving averages are always “lagging” indicators. A trend may already be changing to the opposite, despite what moving average lines suggest at a given time. This is because moving averages are just an average of what has happened in a given past, so things unwind later in terms of moving averages compared to what is taking place at the present.
Price Crossovers
A price crossover takes place when the price candlestick of a financial instrument crosses a certain moving average line, either to the upside or to the downside.
When the price candle crosses up a moving average, it is usually considered a bullish signal.
And when the price crosses down a moving average, it is usually considered a bearish signal.

The length of a moving average will determine the frequency of a signal. It could take much longer for the price to cross SMA200 than it would take to cross SMA 10, so SMA200 will likely cross the price candlestick much less frequently than SMA
As the length of moving averages determines how fast they react to price changes, traders use longer moving averages to analyze the major, long-term trend and shorter moving averages to identify shorter trends.
In that sense, a trader looks for bullish shorter-term moving average crossovers inside the major trend. On the other hand, there can be a lot of contradicting crossovers in a long-term trend. For example, there can be many bullish crossovers within a long-term downtrend, which can act as quick “swinging” opportunities.
Double Crossovers
A double crossover happens when a shorter-length moving average crosses a longer-length moving average. When moving averages with two different time lengths cross, this may possibly indicate a shift in the trend.
There are two types of double crossovers:
Death Cross
A death cross happens when a shorter moving average (usually 50 SMA or EMA) crosses below a longer moving average (usually 200 SMA or EMA). In that regard, a death cross indicates a BEARISH signal.
Golden Cross
A golden cross happens when a shorter moving average (usually 50 SMA or EMA) crosses above a longer moving average (usually 200 SMA or EMA). Golden cross signals a bullish turn in the market.
Tip:
You should note that double crossovers are generally precursory indicators; the market may not move up upon a golden cross, or crash upon a death cross and may just end up doing nothing at all.
For information purposes only. Not investment or financial advice. Seek professional advice. Digital assets involve risk. Do your own research.