On-chain data refers to the tools that are used to value and assess the evolving nature of finance. Traditional valuation methods and analysis aren’t applicable to the digital, newly developed assets and markets around cryptocurrency and blockchain; on-chain data is used to fill the void. The public ledgers and openness that comprise the markets and networks around cryptocurrency makes on-chain data and analysis possible, which is a diverging characteristic between these markets and their traditional counterparts. On-chain data can be traced back to metrics created in the earlier days of crypto markets in 2011, but started to gain widespread adoption and development between 2015 and 2017.
What Does it Tell Us?
On-chain data offers insight into the behaviors of holders, miners, speculators, and any other party interacting with or holding up a network or market, in addition to adoption curves and network value. Nothing is hidden when assessing on-chain data; everything from the economics of a market or token to the health of a given network can be derived from this class of data.
Why is it Important?
By using on-chain data, the way in which market sentiment and behavior is analyzed has changed forever. No other asset class or market allows participants to openly and freely see the inner workings of its underlying system and structure. Breaking the mold of traditional analysis practices, on-chain data gives every market and network participant an equal playing field to conduct analysis, make decisions, and understand the ebb of a market or network.
On-Chain Data Examples and What They Portray
Holder Data – Hodl waves
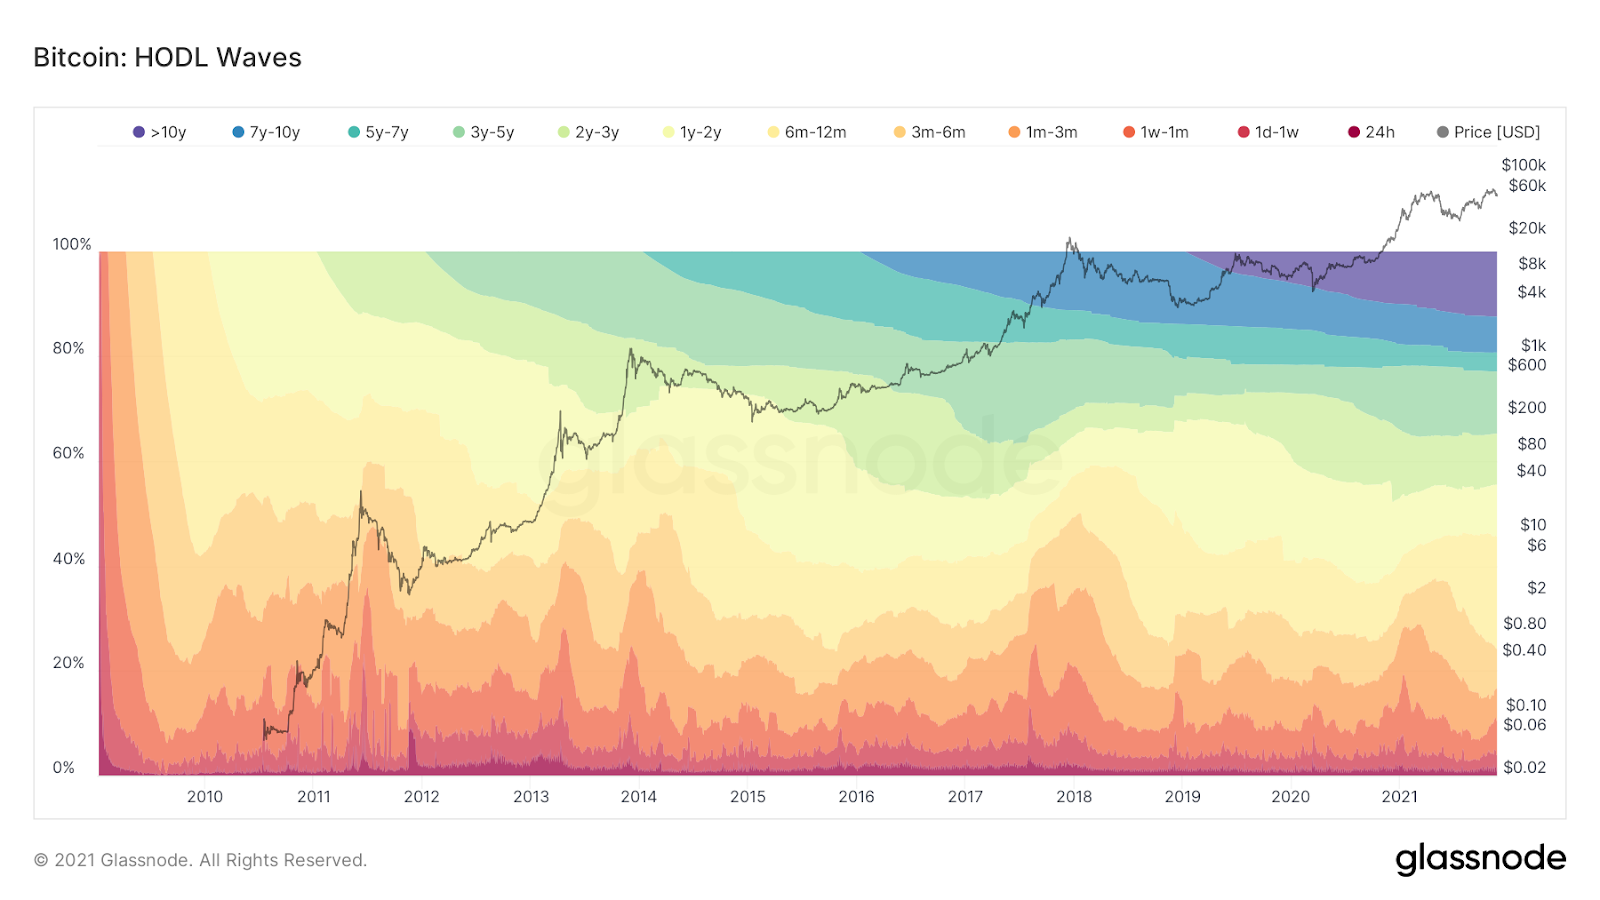
Description: Hodl waves are an indicator used to track the accumulation and spending behavior of Bitcoin holders, which can offer perspective for micro and macro trends in Bitcoin’s market. Each colored band represents an age group of coins and fluctuates based on the behavior of their holders; a widening band indicates the number of coins within a specific age group is growing (accumulation) and a dwindling band indicates the number of coins within a specific age group is decreasing (spending/selling).
Miner Data – Miner revenue
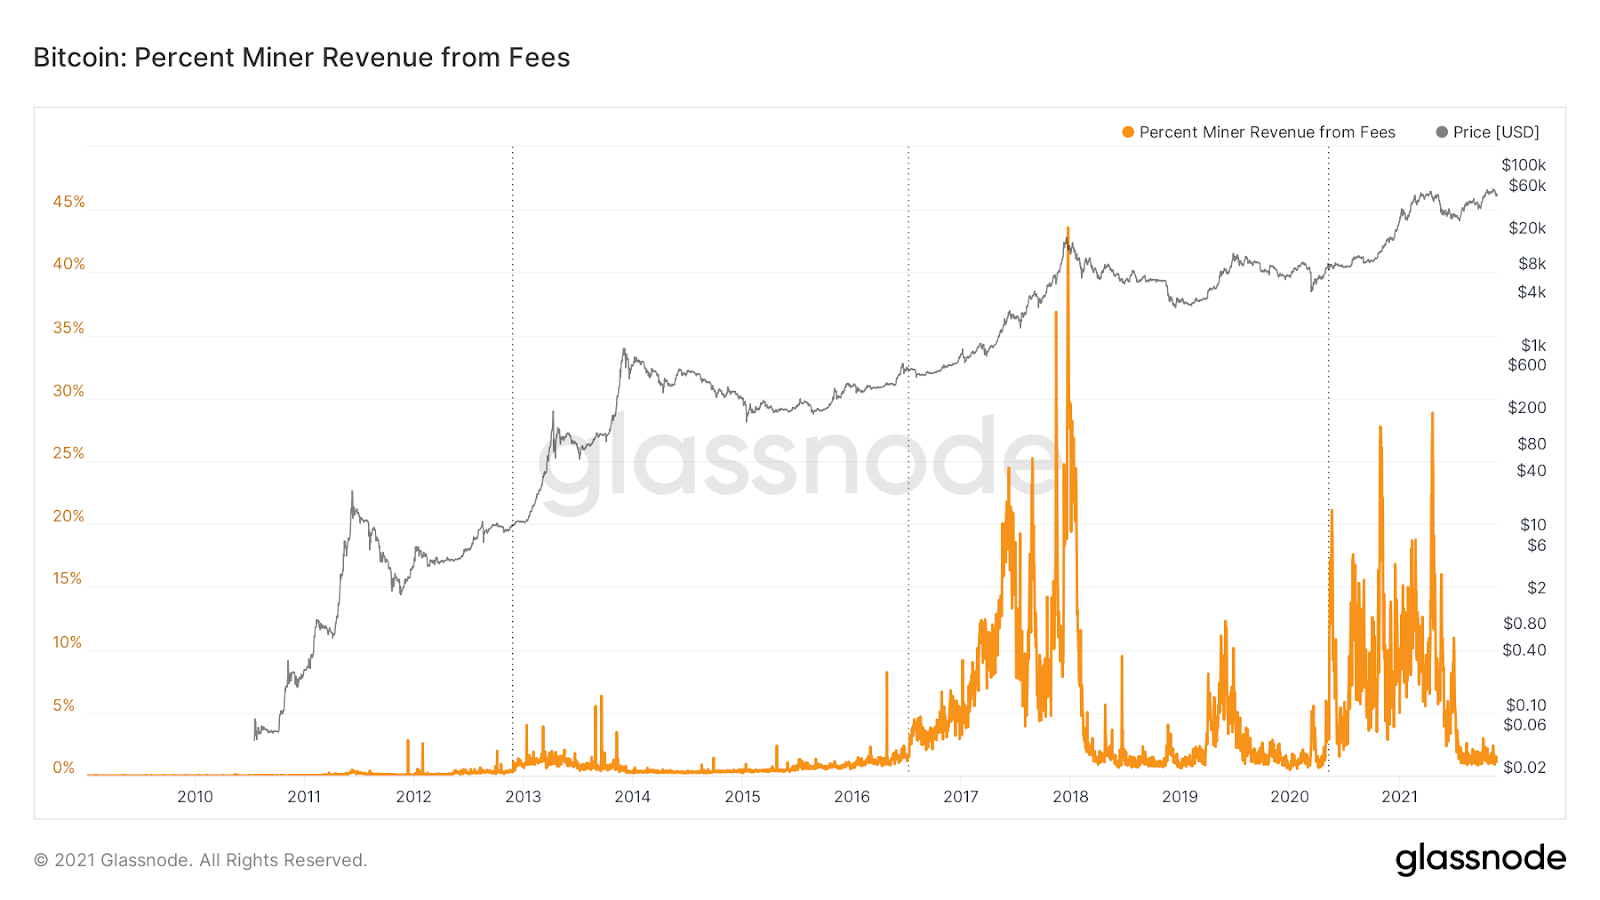
Description: Miner related on-chain data offers insight into miners’ operations and components like their revenue and how it is divided up. Understanding the roots of miner income and how profitable they may or may not be is important to assessing the state of those entities bringing new BTC into circulation. Miners earn revenue in two ways: (1) reward for discovering new blocks and (2) fee revenue from confirming on-chain transactions. The chart above outlines the portion of miner revenue that is generated by transaction fee collection, which is calculated by fee revenue by total revenue.
Speculator Data – Open interest
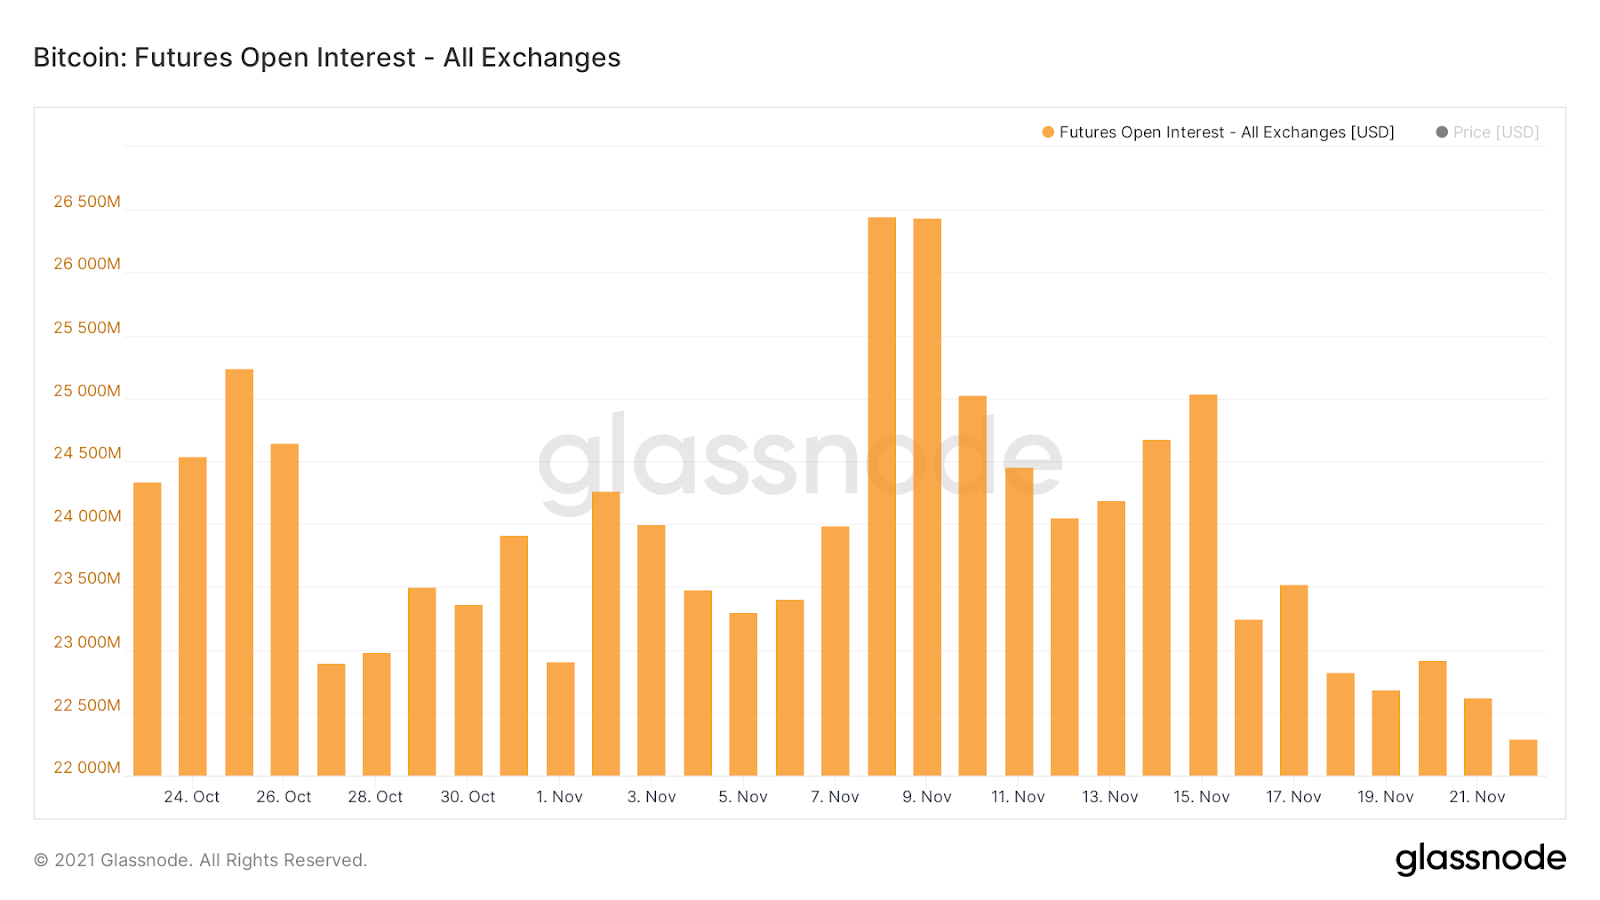
Description: Speculator data, like open interest (OI), keeps tabs on the behavior speculators to assess their potential impact on the market. Rising open interest means there is an increasing amount of USD allocated to open futures contracts, and the opposite when there is a decreasing amount of OI. The leverage available to speculators influences Bitcoin’s market price, making metrics such as open interest important to monitor when assessing the market.
State of the Network – Hash power
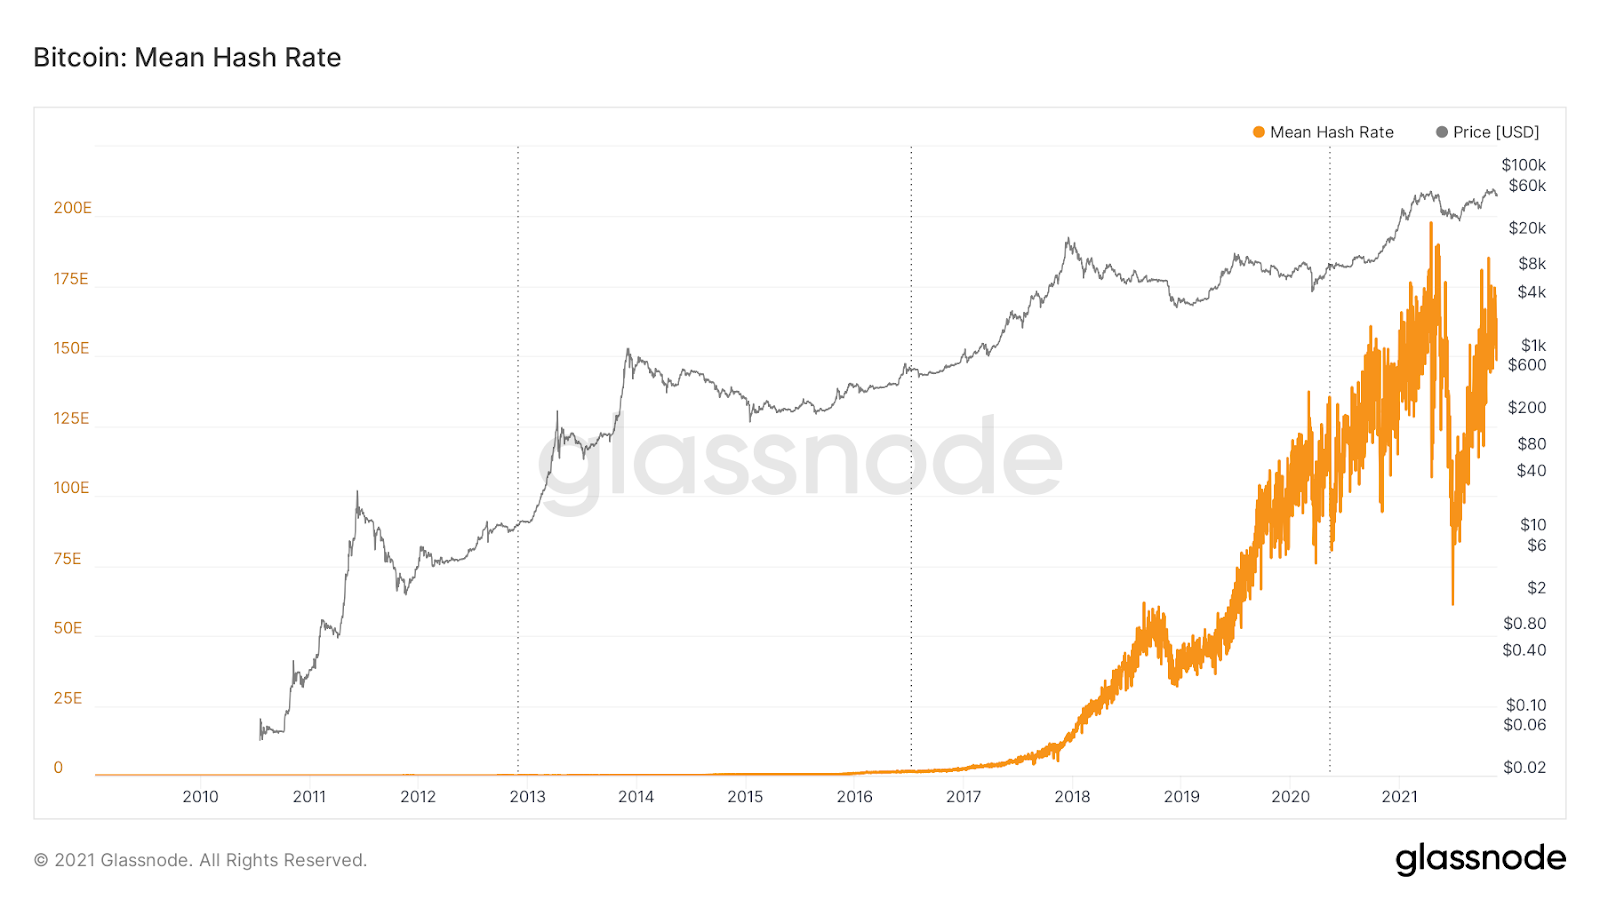
Description: Network health metrics allow for the analysis of the network’s strengths and weaknesses at any point in time. These metrics add color to the components of the network that hinder or advance its functionality, which often has ties to the market value of BTC. Hash power, for example, offers a view of the network’s computing power, which is directly related to its ability to approve transactions and its security.
Economic Data: Supply side
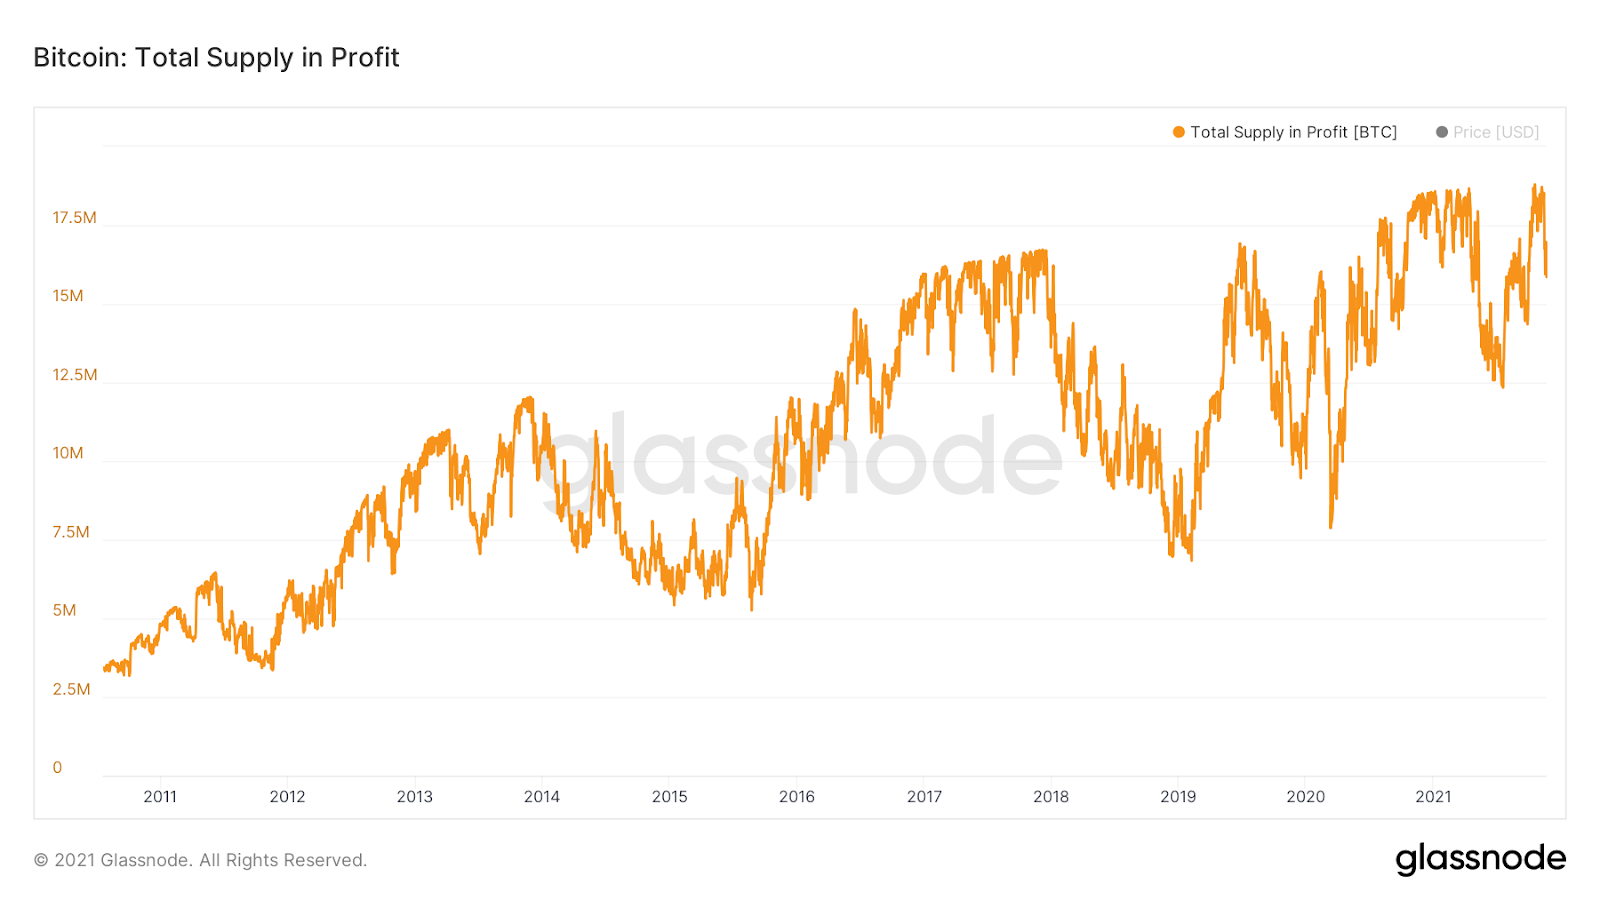
Description: A major differentiator of some digital assets, like Bitcoin, is their fixed and known supply schedules; on-chain metrics leverage this attribute by tracking fluctuations in and various characteristics of the supply side of the equation. Total supply in profit is an indicator that tracks the portion of circulating supply that is profitable, which is key in understanding the price at which BTC is being valued by the market and where profit may be taken. Other supply side economic data points, such as exchange balance, supply held by miners, and wallet addresses with any number of coins, provide alternative perspectives on Bitcoin’s supply and its distribution.
Value – NVT Ratio
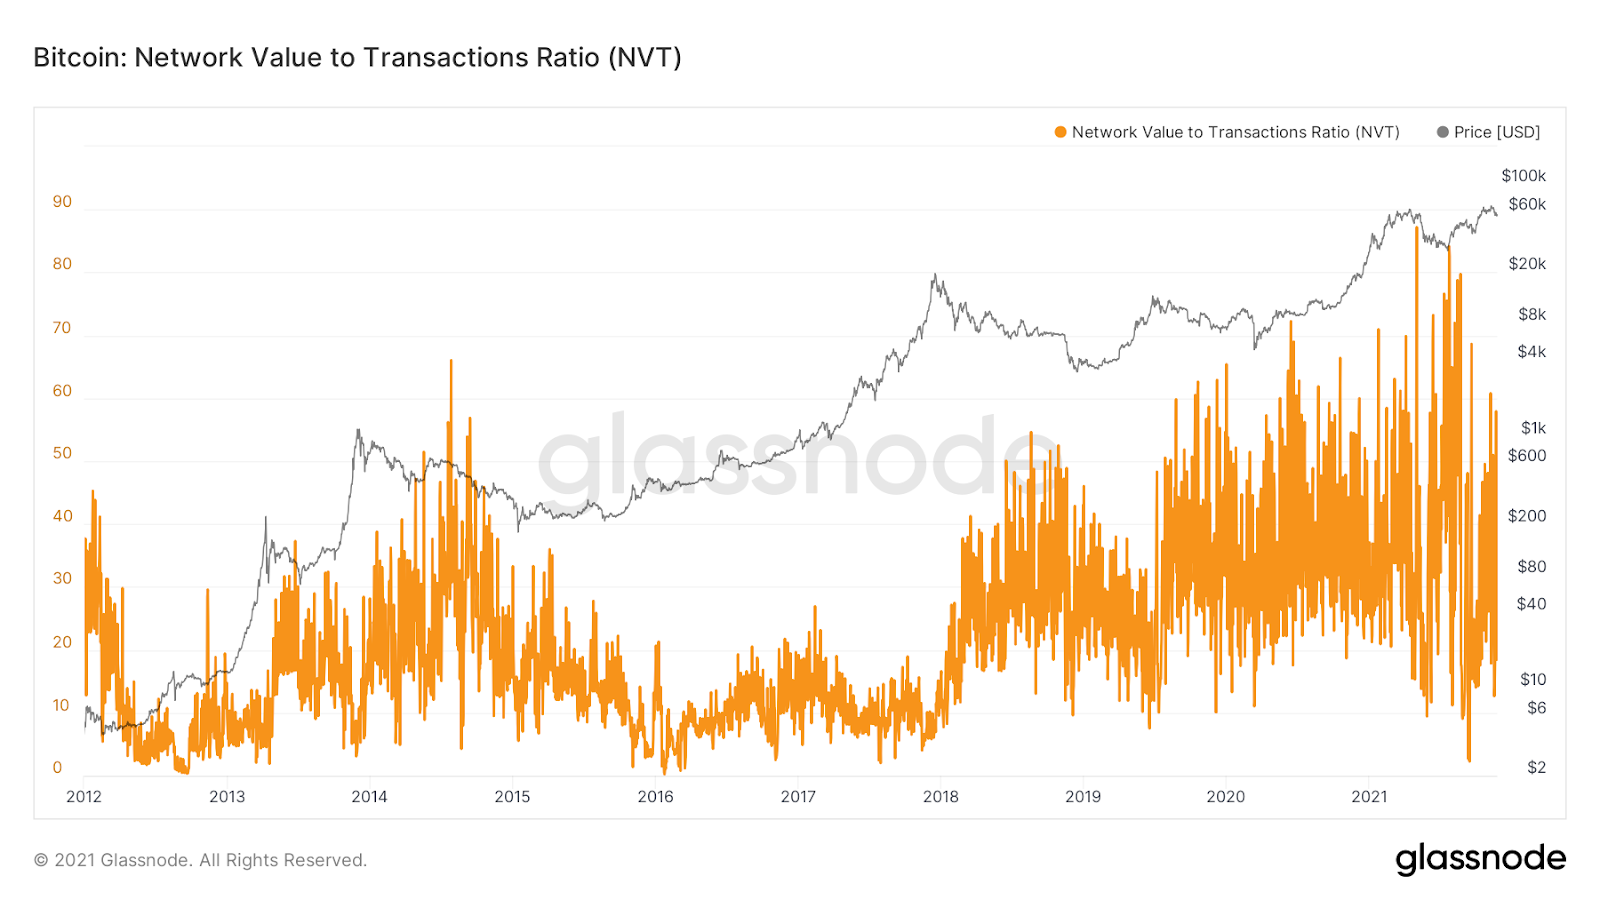
Description: The Network Value to Transaction Ratio (NVT Ratio) is a metric that outlines the relationship between a network’s on-chain transfer volume and market capitalization; or total market cap divided by daily amount of BTC transferred on-chain (measured in USD). It is used to identify if increases in market cap are held up by increased network use or by an alternative source. NVT is closely related to the Price to Earnings Ratio that is widely used to understand if equities are overbought or oversold. The open transactional ledger of digital assets allows this metric to always be known.
Adoption – Non-Zero Addresses
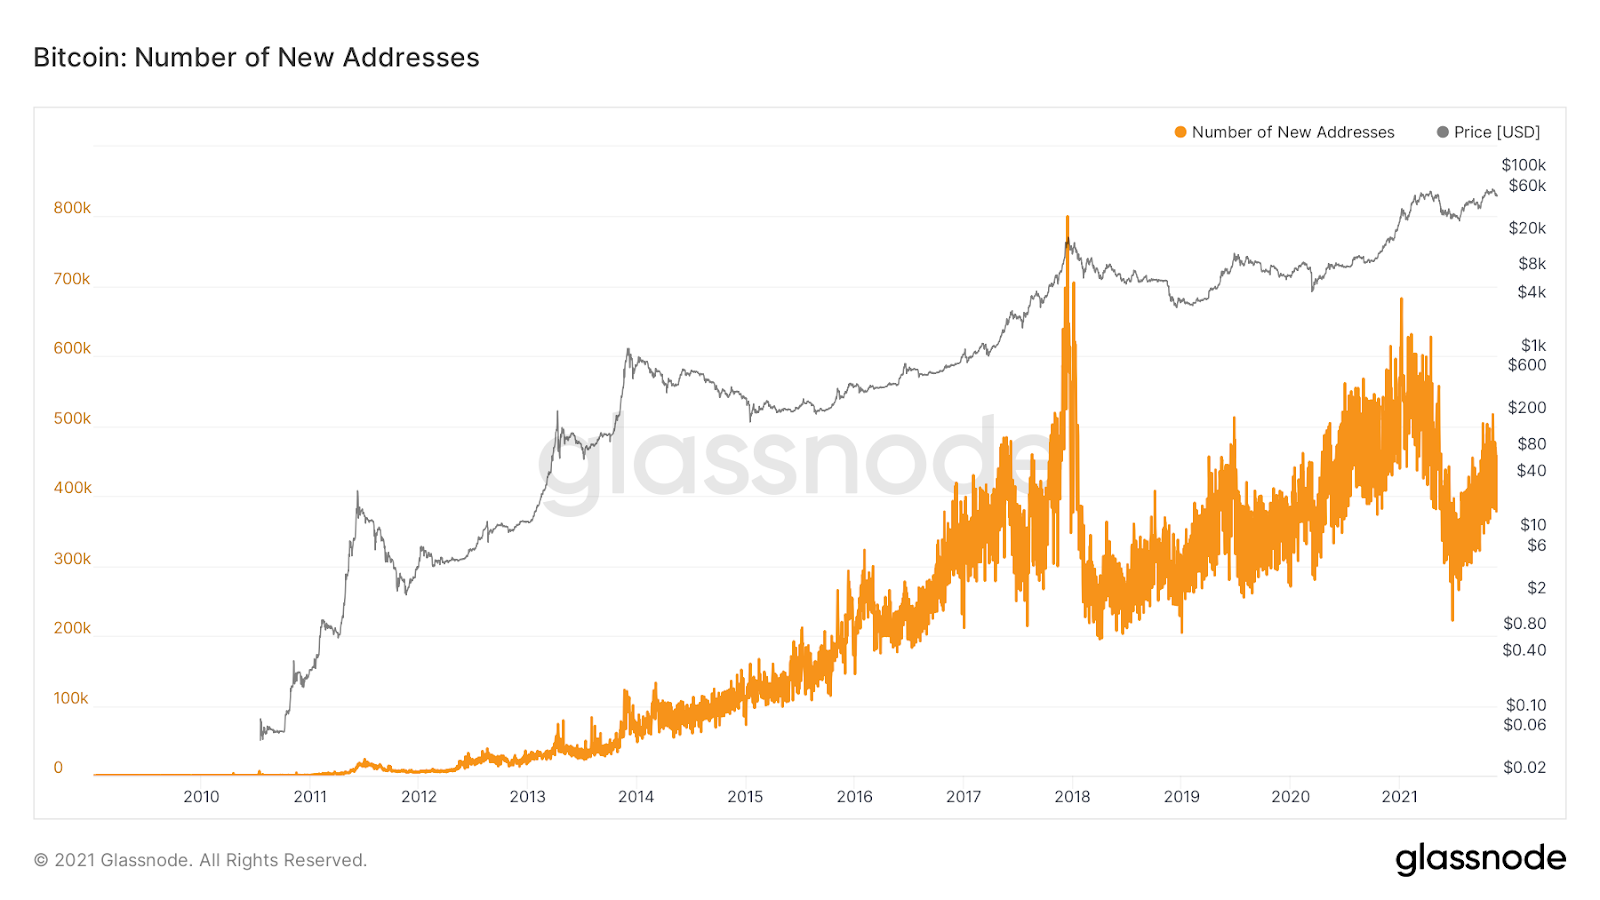
Description: Adoption is a primary driver of value in technology-based markets and assets, but is often difficult to measure. On-chain data offers a suite of metrics, including the number of new addresses, that quantify the rate of adoption of cryptocurrencies. Adoption metrics outlined by on-chain data also allow for analysis of adoption from specific groups of users, which allow for various types of adoption analyses to be conducted.
Institution Behavior
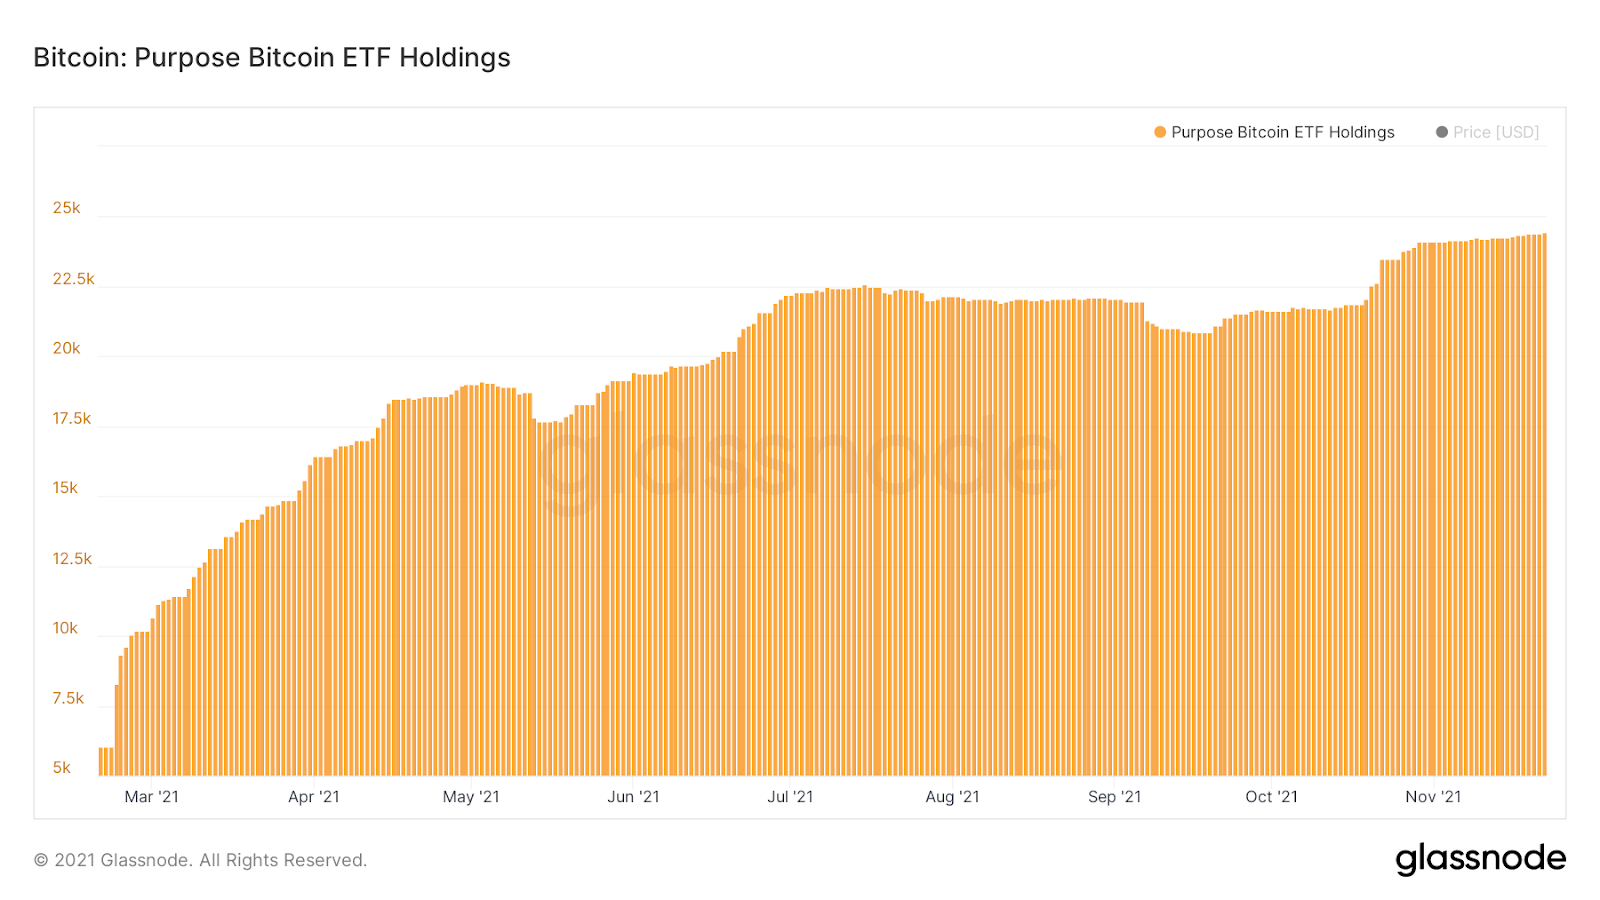
Description: On-chain data lets those assessing the market to get a grip on the activities of institutional players, who often have an upper hand in how the market moves. Examples of metrics that track institutional behavior include the holdings of large funds and ETFs like the Purpose ETF and Grayscale BTC Trust, in addition to OTC desk activities. The ability to track the movements of large players is valuable in any market, however, crypto and on-chain data are among the only markets and sources that allow for such information to be easily known and readily available.
The above are only a few examples of the current reach and depth of on-chain data’s insight into the ecosystems and markets around blockchain. On-chain data will play an even bigger role in the analysis of blockchain and its corresponding markets as the space continues to expand and grow more interoperable. Follow CEX.IO to learn more about on-chain data metrics and to understand how they can be used to analyze cryptocurrencies like Bitcoin and Ethereum.
For information purposes only. Not investment or financial advice. Seek professional advice. Digital assets involve risk. Do your own research.